
The Politicians tab contains congressional disclosure data organized by individual members of Congress. It includes three sections:
- Activity Over Time: A chart showing disclosure activity trends over the selected period, broken down by House Democrat, House Republican, Senate Democrat, and Senate Republican.
- Politicians: A table of all politicians with aggregate disclosure data for the selected period.
- Top 50 Politicians — Total Trades: A ranking of the most active politicians by total transaction count.
The tab includes a Filters panel at the top, which applies to all three sections. It contains a politician name search field, a Volume/Trades toggle (switches the sorting metric), and a date range picker. The panel is sticky and can be collapsed using the arrow in the top-right corner.
1. Key Behaviors
Sections in the tab share the following interactive features.
1.1. Tooltip on Hover
Hovering over the Activity Over Time and the Top 50 Politicians charts displays a tooltip with the corresponding label and value.
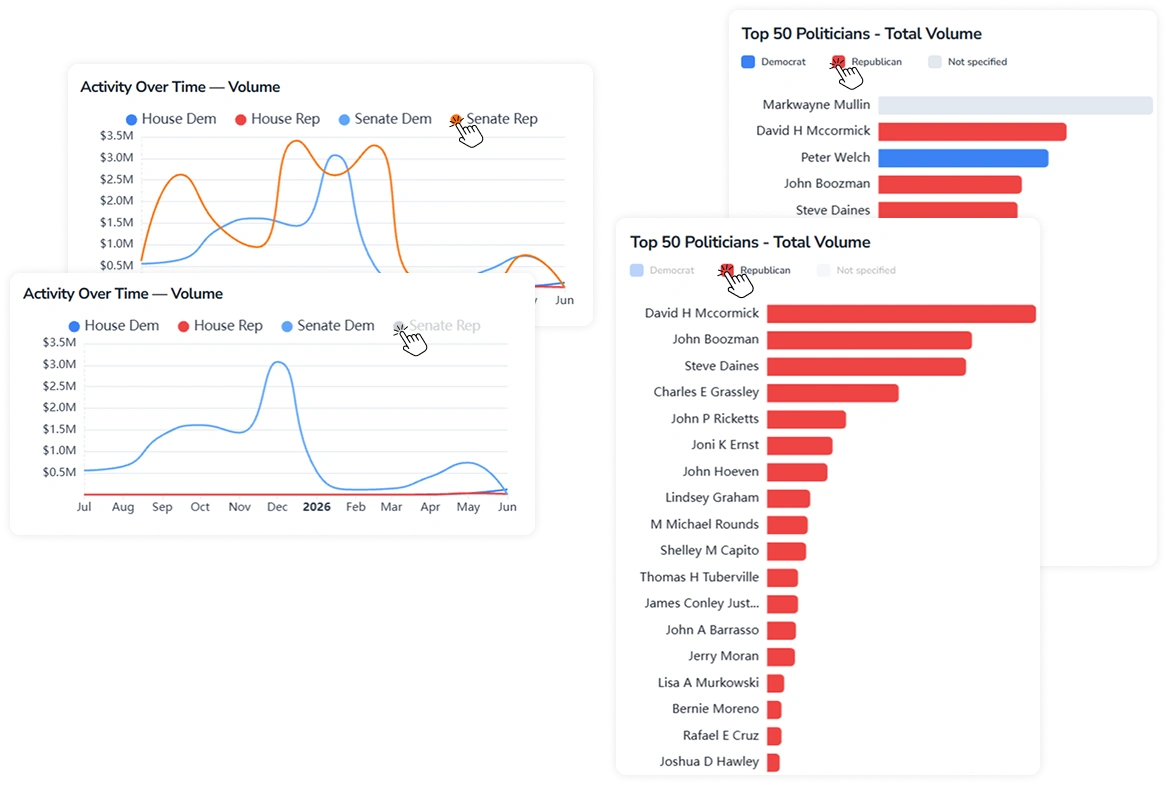
1.2. Toggling Legend Items
Both charts include an interactive legend with party names and colored indicators. The behavior differs between the two:
- Activity Over Time: Press a legend item to remove the corresponding line from the chart. Press again to restore it.
- Top 50 Politicians: Press a legend item to isolate the corresponding group. Press again to restore the full view.
2. Politicians Table
The table displays all politicians with their total trade count, disclosed volume, number of distinct tickers, and date of last transaction.
The Party column uses color coding:
- REP (Republican) in red
- DEM (Democrat) in blue
- IND (Independent/Not specified) in grey
The table also supports standard column sorting (see the Sorting Guide) and pagination.