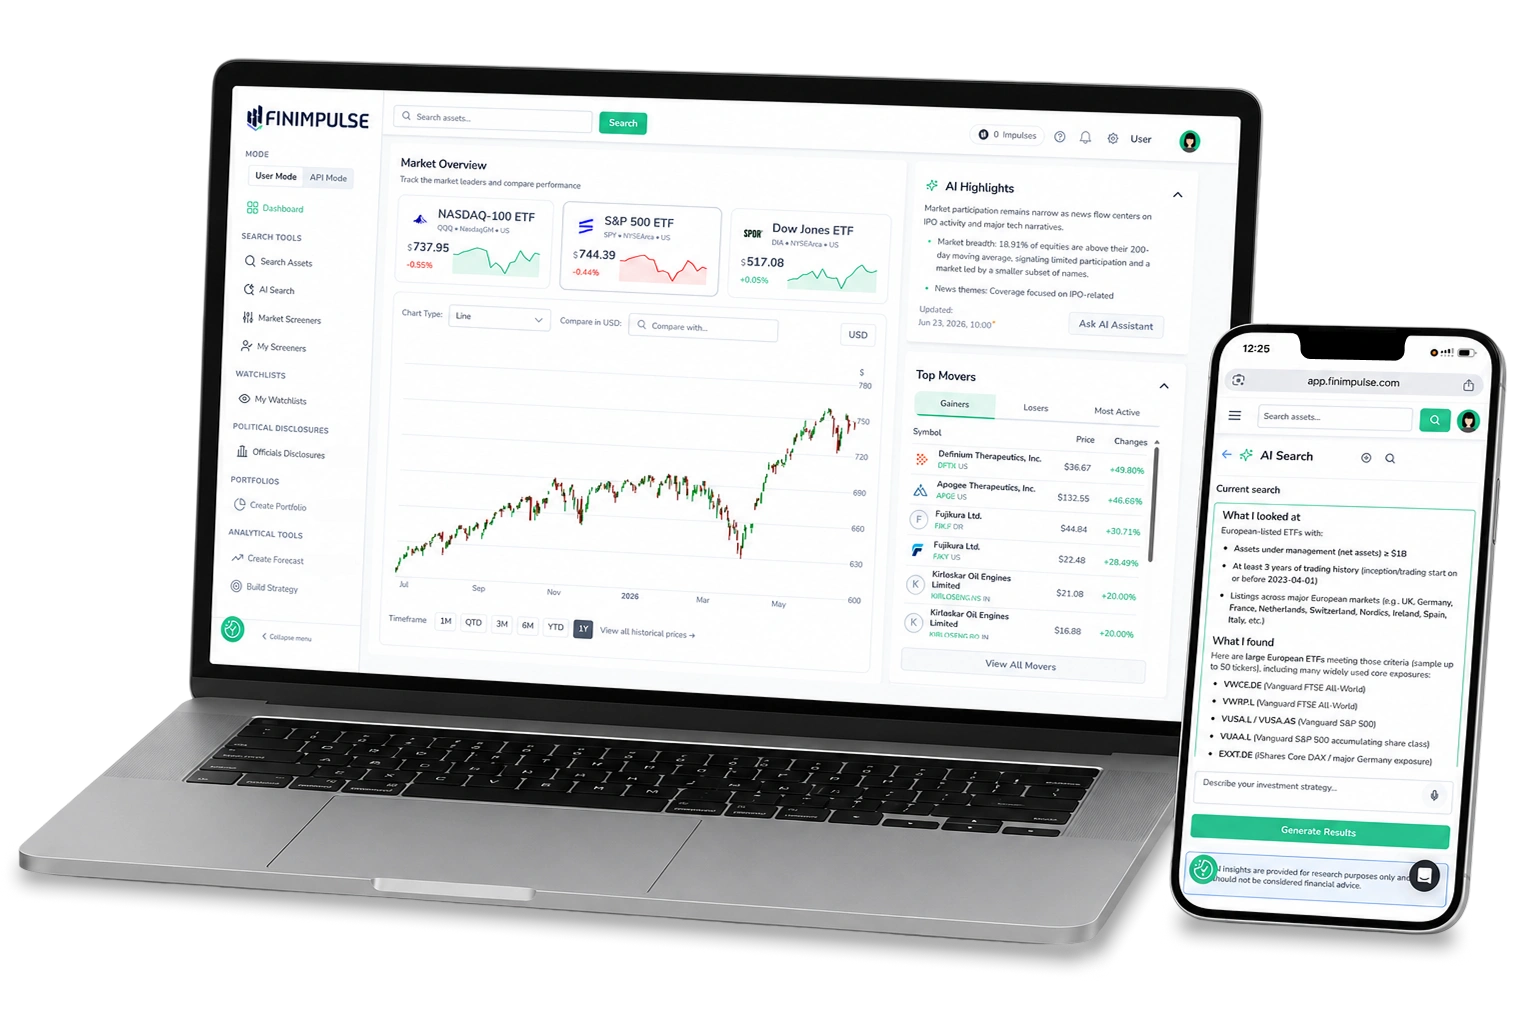
Work with financial data in FinImpulse Dashboard
Analyze and manage stocks, ETFs, and funds across global markets — with financial metrics and AI tools
Coverage across global markets and asset classes
Stocks, ETFs, and mutual funds across international markets with long-term history and unified pricing
Stocks
Public companies across global exchanges
Financials, performance, and ownership
ETFs
ETF datasets with holdings and structure
Allocation details and fund composition
Mutual Funds
Fund datasets with NAV and composition
Performance and allocation details
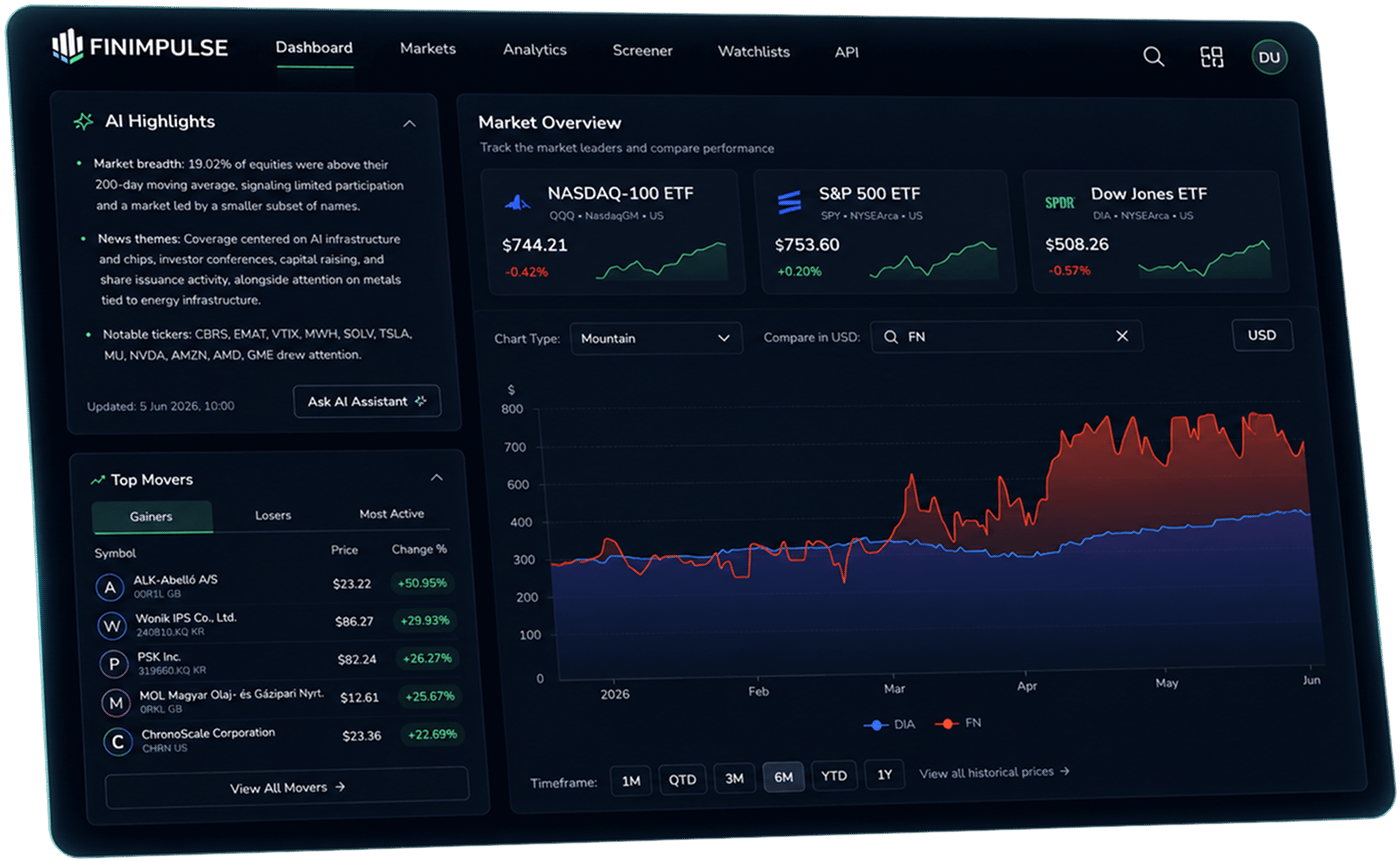
Global Coverage
Work with financial datasets across global markets:
- Access 600,000+ assets across 90+ global markets
- Compare stocks, ETFs, and mutual funds in one environment
- Use USD-normalized pricing across exchanges, regions, and currencies
- Analyze up to 30 years of historical data across market cycles
All datasets are standardized for consistent screening, comparison, and long-term financial research.

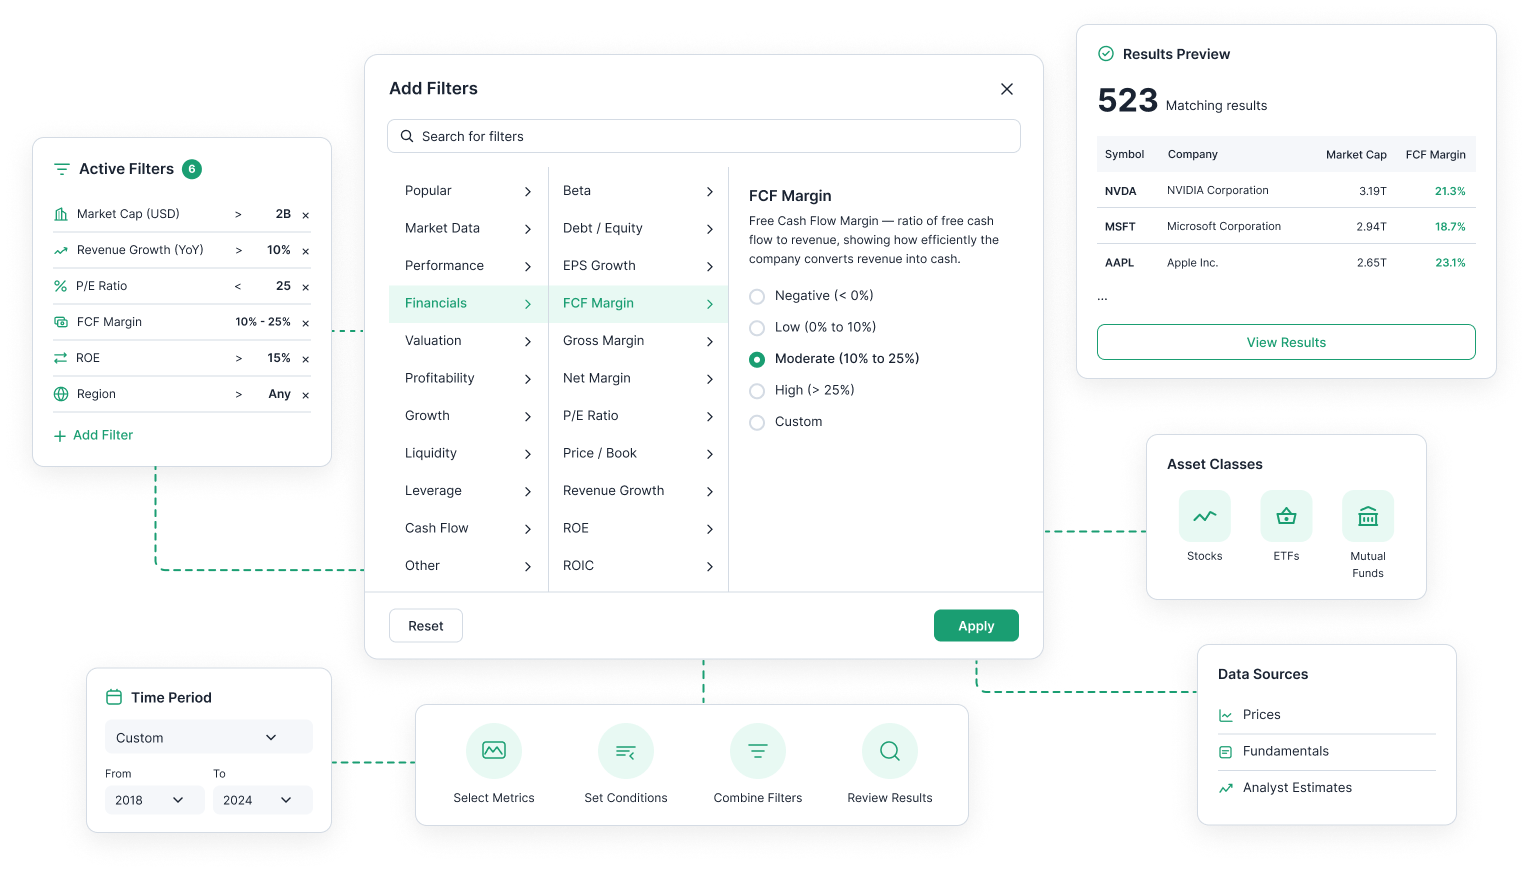
Search and Filtering
Use predefined filters or build custom queries across financial datasets:
- Filter by financial metrics such as revenue, margins, growth, and valuation ratios
- Apply conditions across multiple fields and time periods
- Combine filters across asset classes and markets
- Work with datasets covering prices, fundamentals, and analyst data
The system supports complex queries without requiring manual dataset alignment
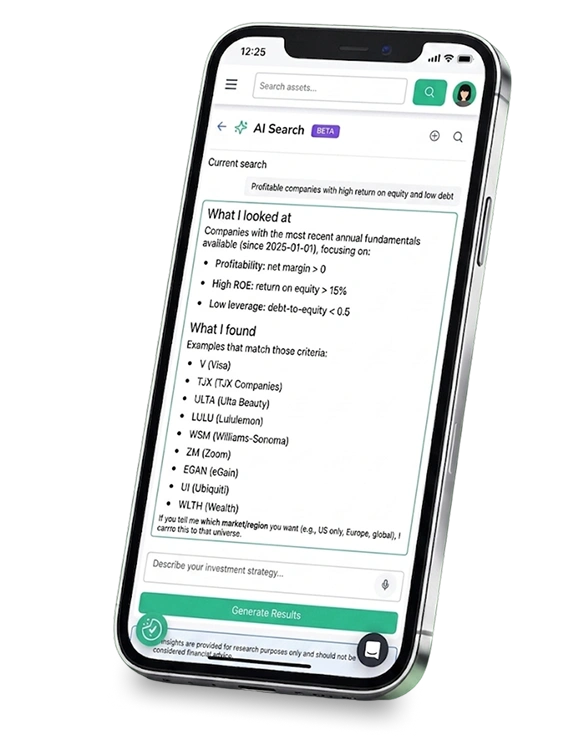
Find assets using natural language
Describe what you are looking for in natural language, and AI Search returns matching assets across stocks, ETFs, and mutual funds.
Search in multiple languages while the system translates your request into financial filters, metrics, and asset conditions without manual screener setup.
Combine fundamentals, analyst estimates, holdings, performance metrics, and historical data within a single query.
AI Search helps you discover, compare, and filter global financial datasets faster through flexible, data-driven search.
Financial filters
Find companies by balance sheet values, margins, or growth ranges
Analyst signals
Identify assets based on price targets or rating trends and signals
Fund exposure
Find funds with exposure to selected sectors, assets, or regions
Market Queries
Combine fundamentals, prices, and historical data in a single query
Metric Relations
Compare growth, profitability, and risk across asset groups
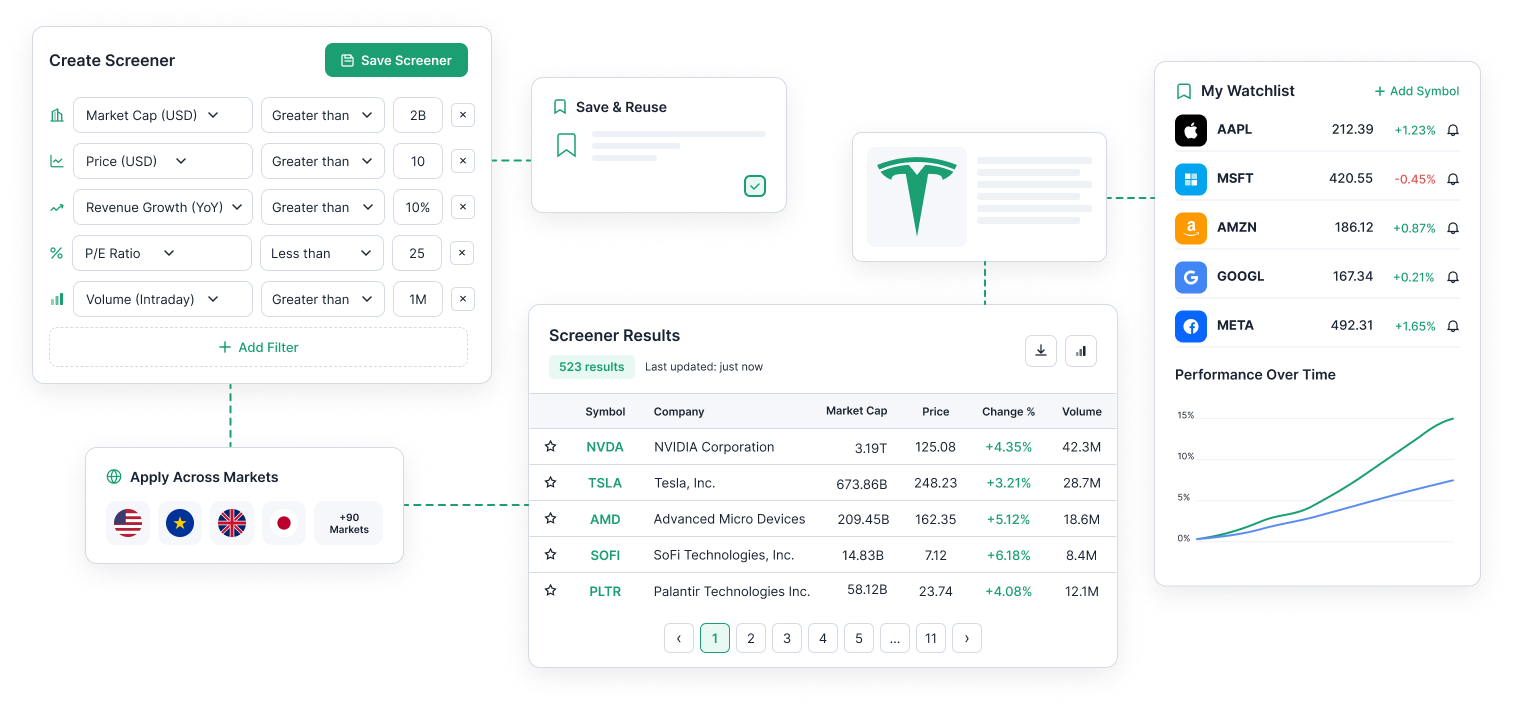
Screeners and Watchlists
Build reusable screeners using financial metrics, filters, and custom conditions:
- Save and manage screening configurations for repeated research workflows
- Track filtered datasets, watchlists, and market changes over time
- Apply the same screening logic across stocks, ETFs, and mutual funds
- Combine multiple metrics, filters, and timeframes into advanced search queries
Screeners and watchlists support ongoing market research without rebuilding filters from scratch.
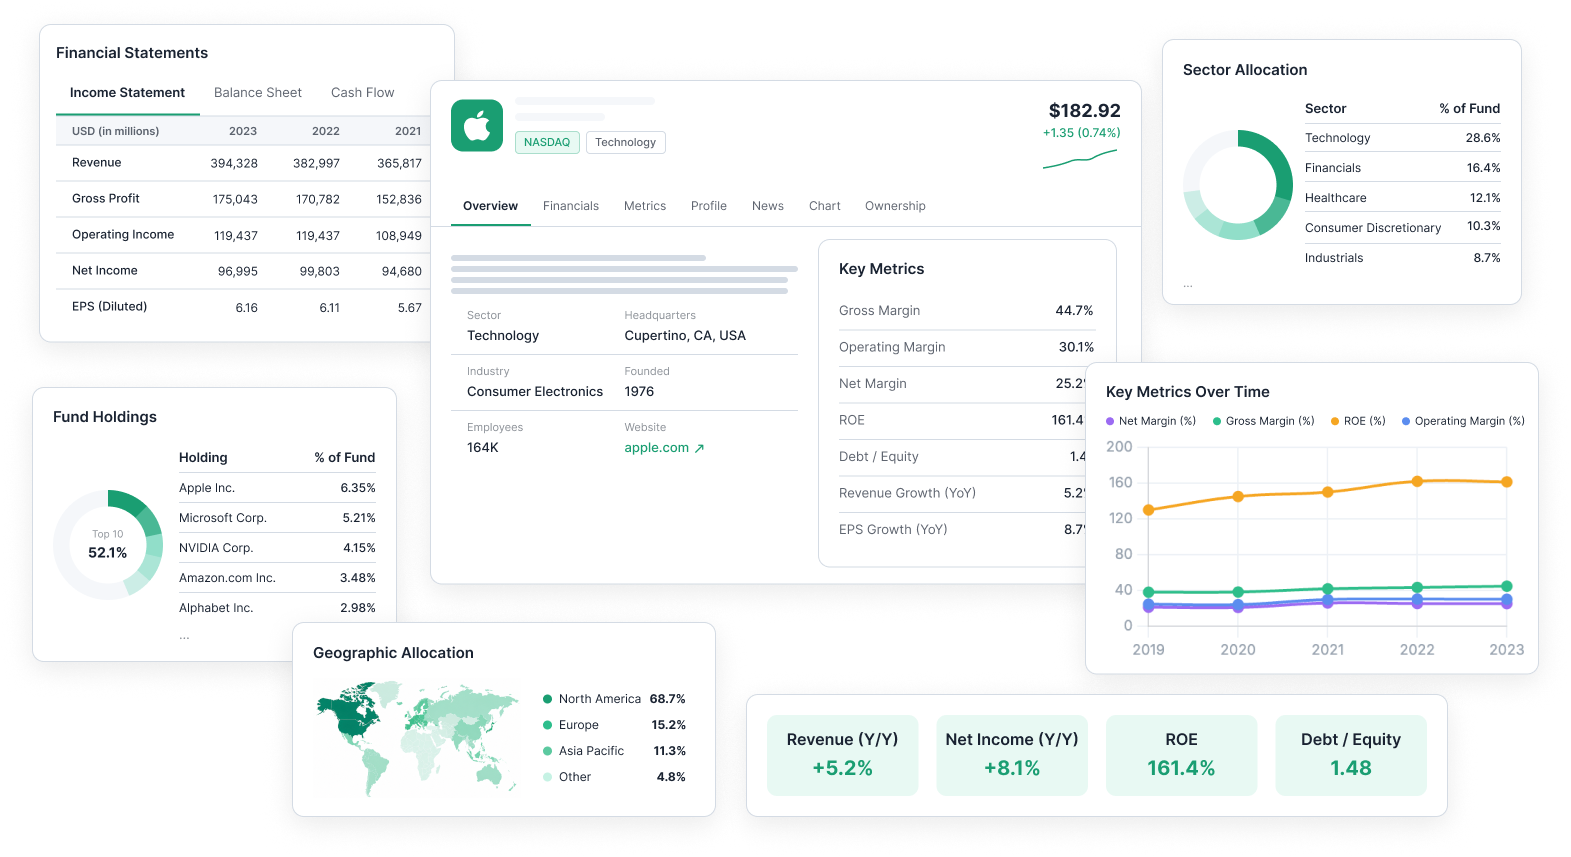
Companies and funds data
Access detailed datasets for individual assets across global markets:
- Review company profiles, sector classifications, and asset metadata
- Analyze financial statements including income, balance sheet, and cash flow data
- Compare key metrics such as margins, growth, profitability, and leverage
- Explore fund holdings, allocation breakdowns, sector exposure, and composition
All datasets are standardized across assets and time periods for consistent comparison and analysis.
Work across markets, datasets, and strategies in one platform
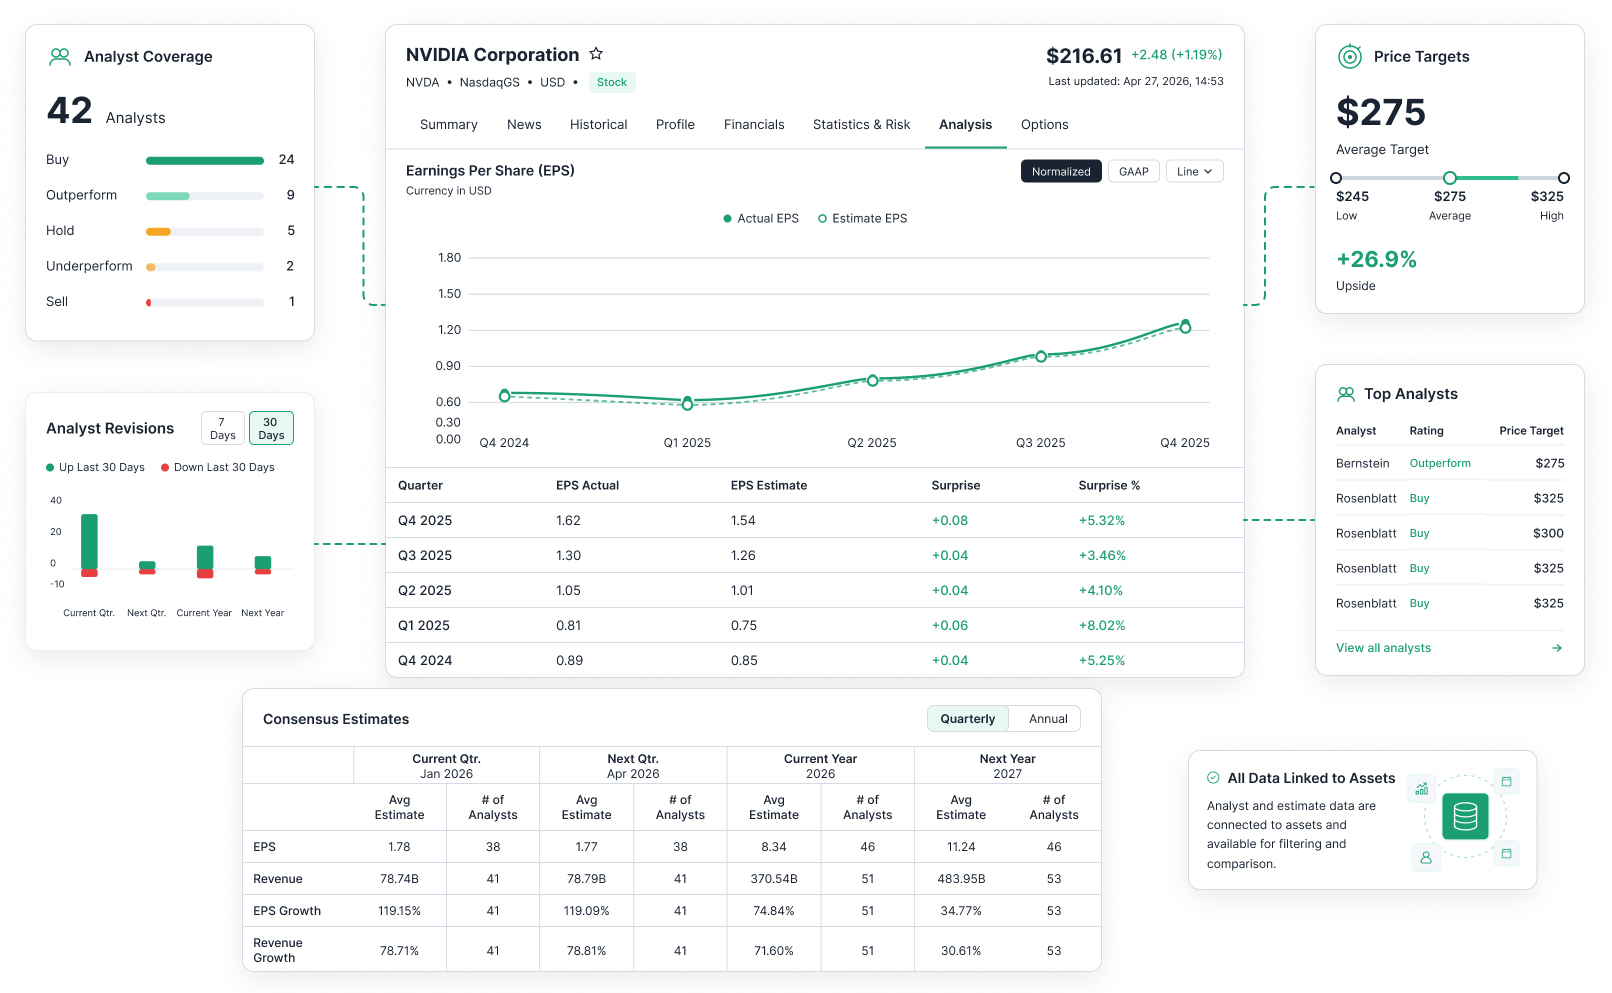
Analyst, earnings, and estimates data
Work with analyst, earnings, and estimate datasets:
- Access earnings estimates, historical EPS results, revenue forecasts, and growth projections
- Track analyst coverage, ratings distribution, revisions activity, and recommendation trends
- Compare price targets, consensus estimates, upside potential, and top analyst performance
- Monitor EPS trends, estimate changes over time, and revision momentum across reporting periods
All datasets are linked to assets and integrated into the platform for filtering, comparison, and long-term financial analysis.
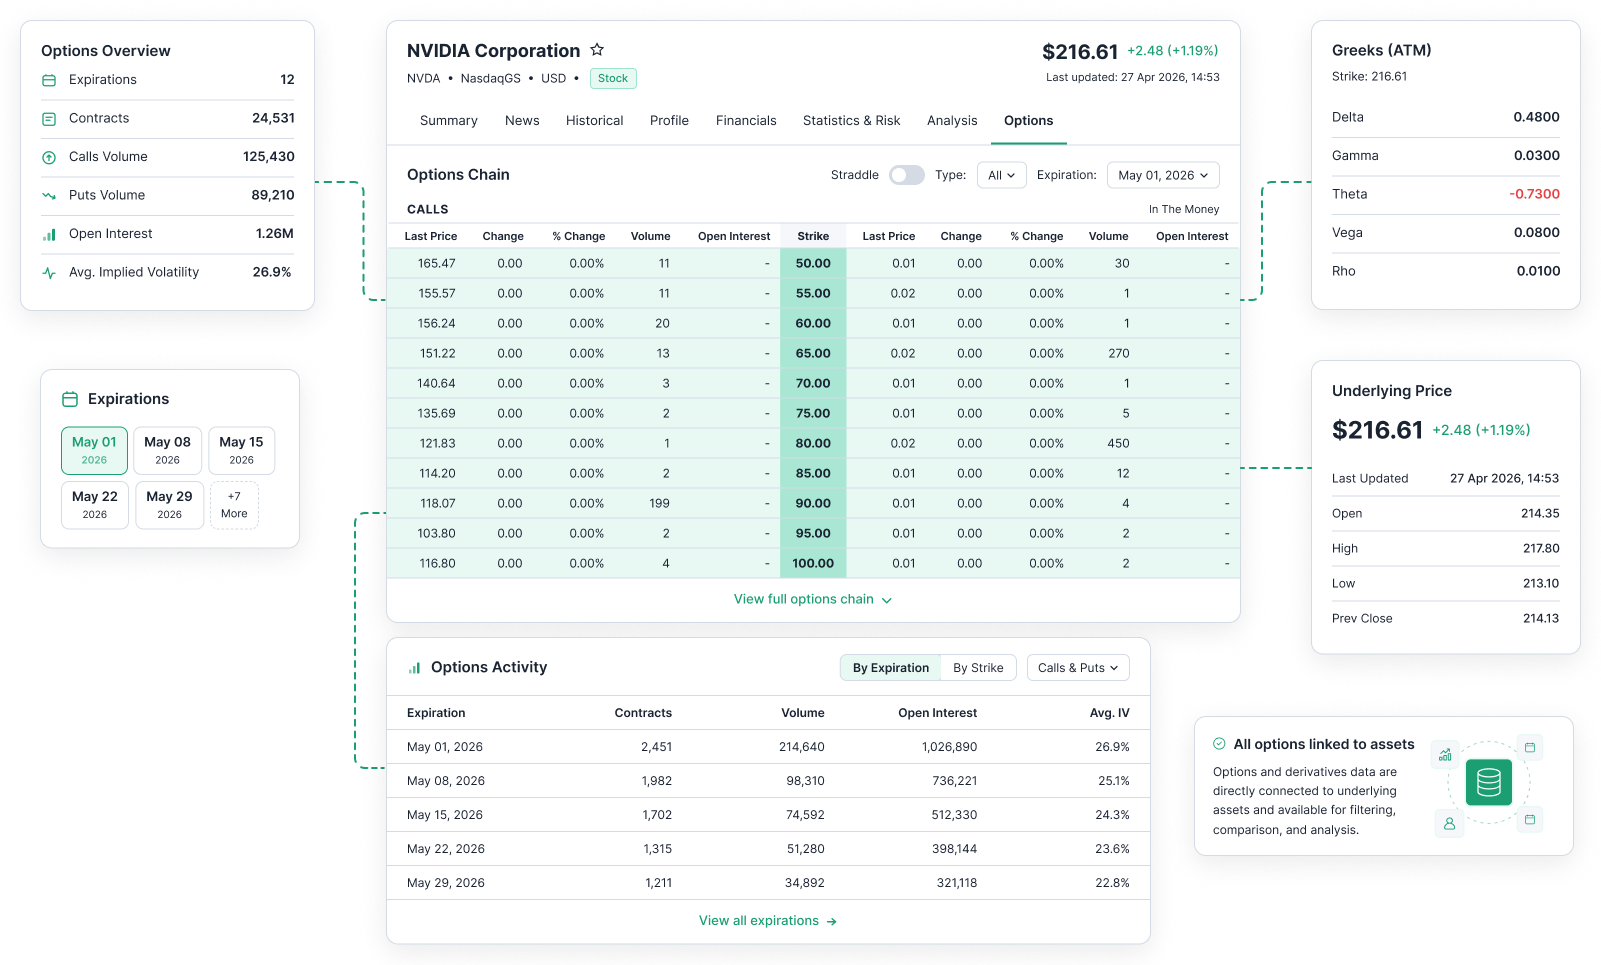
Options and derivatives data
Work with options chain and contract datasets across global markets:
- Access expiration dates, strike prices, calls, puts, and full contract chain data
- Analyze bid/ask pricing, volume, open interest, implied volatility, and contract performance
- Review Greeks including delta, gamma, theta, vega, and rho across individual contracts
- Compare options activity alongside underlying asset prices for broader market analysis
All options datasets are linked to underlying assets and integrated into the platform for screening, comparison, and derivatives research.
One platform for global financial research
Access search, screening, analyst data, options chains, and asset intelligence within a single financial workspace.
- Global markets
- AI-powered search
- Advanced screeners
- Analyst estimates
- Options data
- Unified workflows
Flexible plans for every stage of financial research
Start with a 7-day Premium trial to explore core features.
Upgrade to access extended datasets, advanced filters, and higher usage limits
Basic
$25.00/month
Screeners, watchlists, custom columns, and analytical filters for everyday market tracking.
Create AccountPremium
$47.00/month
Full exports, financial statements, historical news access, and extended analytics tools.
Start Free TrialExpert
$118.00/month
Higher limits, full exports, advanced analytics tools, financial statements, and priority support.
Create Account