Use Cases

Use Cases / REST API

Build Stock Screening Platforms Using Ticker Search API
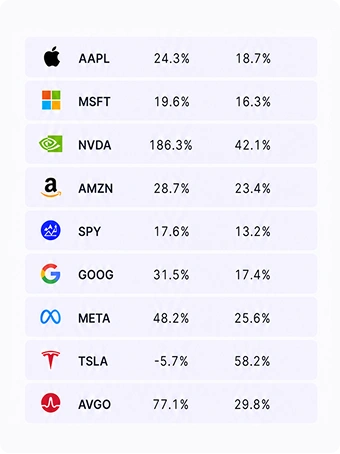
Table showing nine assets (stocks and an ETF) with ticker symbols and two percentage figures per row, alongside each company's brand icon.

Create stock screening platforms and financial search applications using structured market data from a single API. Search and filter global stocks, ETFs, and funds by financial metrics, sectors, exchanges, dividends, market capitalization, and other criteria.

Build custom screeners, research platforms, and portfolio discovery tools with fast, flexible filtering and structured financial data.

Typical use:
  • AI stock screeners
  • Research platforms
  • Asset discovery tools
  • Portfolio discovery
  • Saved screeners
  • Market explorers

Build Live Price Widgets Using Market Price API

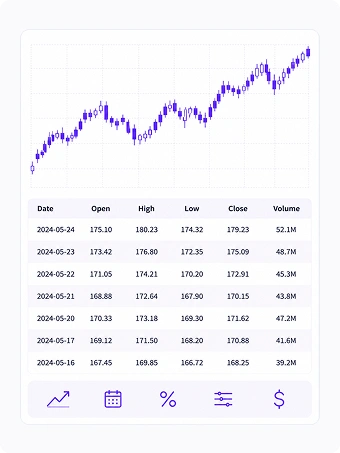
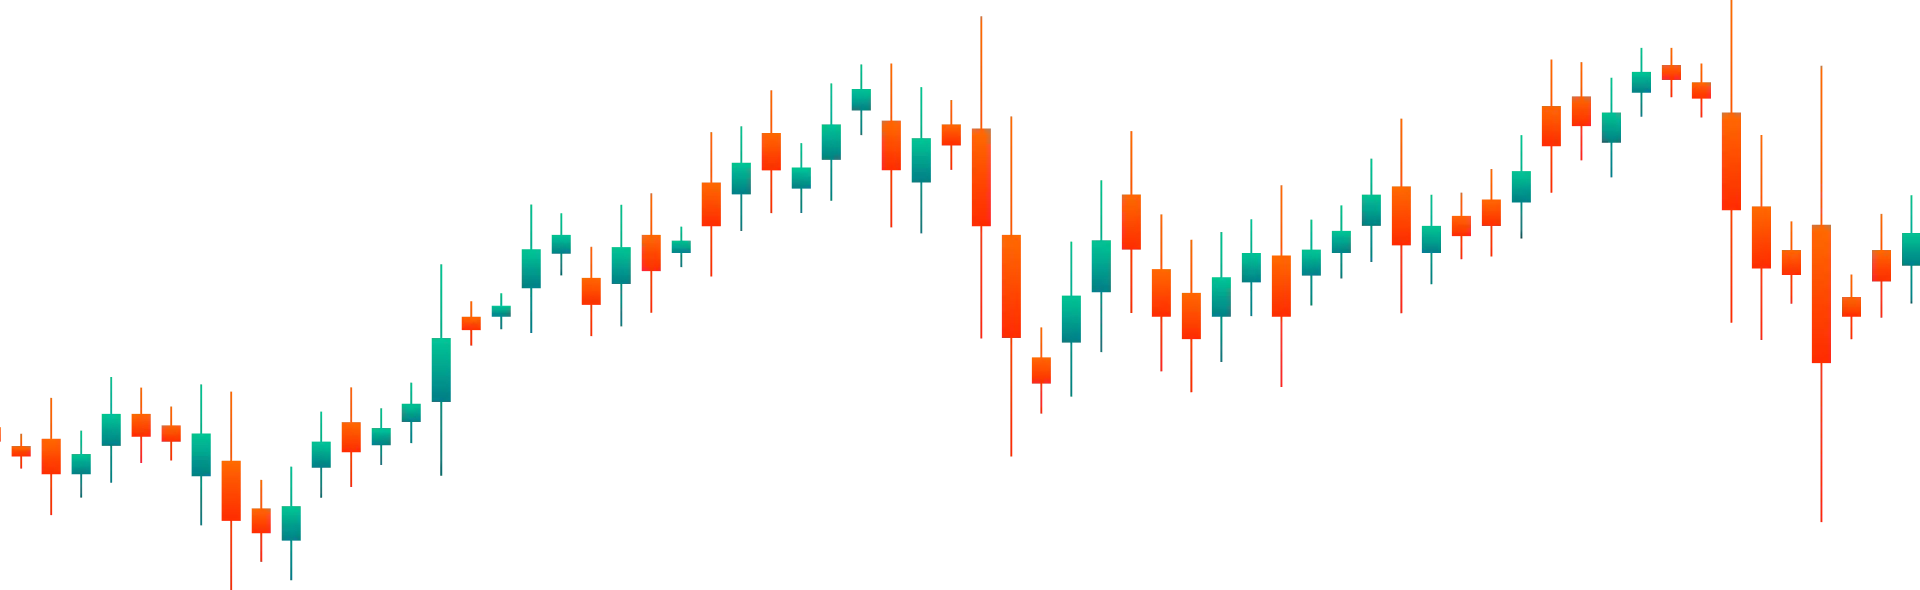
Candlestick price chart above a table listing seven trading days (2024-05-16 through 2024-05-24) with Open, High, Low, Close, and Volume columns, followed by a row of icons for trend, calendar, percentage, filters, and currency.

Retrieve the latest market price, daily change, trading volume, market capitalization, bid/ask data, and market status through a lightweight API. Market Price API provides a current market snapshot for stocks, ETFs, and other supported assets.

Use it to power watchlists, portfolio dashboards, market overview pages, price widgets, and internal business applications with a single API request.

Typical use:
  • Watchlists
  • Market overview pages
  • Portfolio dashboards
  • Internal tools
  • Price widgets
  • Asset snapshots

Build Historical Price Charts Using Historical Prices API

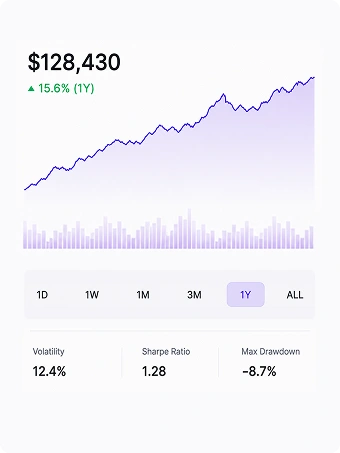
Historical price performance chart showing $128,430 with a +15.6% (1Y) gain, an upward price line over a volume bar chart below, a timeframe selector (1D, 1W, 1M, 3M, 1Y selected, ALL), and three metrics underneath: Volatility 12.4%, Sharpe Ratio 1.28, and Max Drawdown −8.7%.

Retrieve historical price data to build interactive charts, price comparison tools, portfolio performance dashboards, and financial analytics applications. Historical Prices API provides daily, weekly, monthly, and yearly market history for stocks, ETFs, mutual funds, and other supported assets.

Use it to create charting interfaces, asset comparison tools, normalized return views, technical analysis dashboards, backtesting workflows, and historical data exports.

Typical use:
  • Historical price charts
  • Normalized returns
  • Candlestick (OHLC) charts
  • Technical analysis
  • Asset comparison
  • Backtesting

Build Asset Overview Pages Using Summary API

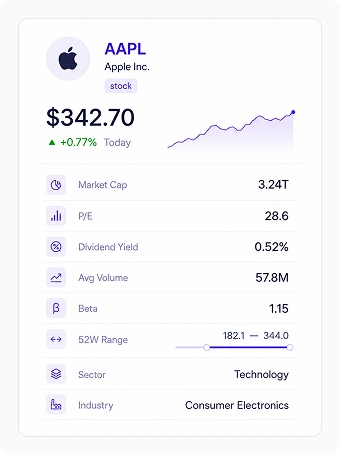
Asset summary card for AAPL (Apple Inc., stock) showing current price $342.70 with a +0.77% daily gain and an upward trend line, followed by a list of metrics: Market Cap 3.24T, P/E 28.6, Dividend Yield 0.52%, Avg Volume 57.8M, Beta 1.15, 52-Week Range 182.1–344.0 (shown as a slider), Sector Technology, and Industry Consumer Electronics.

Retrieve structured asset snapshots for stocks, ETFs, and funds, including pricing, valuation ratios, dividends, volume, market capitalization, sector, industry, country, website, and profile details.

Use Summary Lite API for lightweight overview screens and watchlists, or Summary API when your product needs a deeper asset snapshot with analyst data, profitability metrics, and full company context.

Typical use:
  • Asset overview pages
  • Portfolio asset snapshots
  • Company profile cards
  • AI company lookup
  • Watchlist details
  • Research dashboards

Build Financial News Feeds Using Market News API

Wireframe illustration showing a world map with dotted texture at the top, a building icon with placeholder text lines below it, and a "News" section with three list items, each showing a purple bullet, placeholder text lines, and a gray thumbnail box.

Retrieve structured financial news for stocks, ETFs, funds, and other supported instruments. Market News API helps you build news feeds, asset pages, watchlists, market dashboards, and AI workflows using a single API.

Use Market News API to display the latest headlines, related symbols, sentiment, market reaction, and publication details without integrating multiple news providers.

Typical use:
  • Asset news pages
  • AI market assistants
  • Market news feeds
  • News alerts
  • Watchlist updates
  • Research dashboards

Build Rich Company Pages Using Company Profile API

Wireframe-style company profile page layout showing a header with a building icon, placeholder text lines, and location/website/employee icons; a description section with a document icon; an executive management list with five person icons and placeholder name lines; a governance metrics section with colored progress bars and status dots; and a chart section with a donut chart and a line graph.

Retrieve detailed company profile data for stocks, ETFs, and funds from a single API. Company Profile API includes business descriptions, industry classification, headquarters, websites, executive teams, governance data, company contacts, and additional profile information for financial applications.

Use Company Profile API to build company pages, research platforms, market dashboards, AI assistants, CRM enrichment, and business intelligence tools.

Typical use:
  • Company profile pages
  • CRM enrichment
  • Equity research platforms
  • Market dashboards
  • AI company assistants
  • Business directories

Build Company Financials Using Financial Statements API

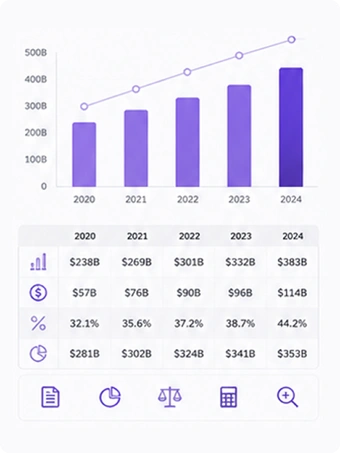
Bar and line chart showing values rising from $238B in 2020 to $383B in 2024, with a connected line trending upward alongside it. Below, a table breaks down four metrics by year (2020-2024) with icons for a bar chart, dollar sign, percentage, and pie chart, followed by a row of five action icons: document, pie chart, scale, calculator, and magnifying glass.

Retrieve structured financial statements and historical valuation metrics for publicly traded companies. Financial Statements API provides multi-period income statements, balance sheets, cash flow statements, and valuation ratios through dedicated endpoints designed for financial analysis and business applications.

Use it to build research platforms, company analysis pages, valuation tools, AI assistants, financial dashboards, and internal analytics systems.

Typical use:
  • Financial statement analysis
  • AI financial assistants
  • Company valuation
  • Financial dashboards
  • Equity research
  • Business analytics

Build Company Metrics Comparison Tools Using Metrics & Dividends API

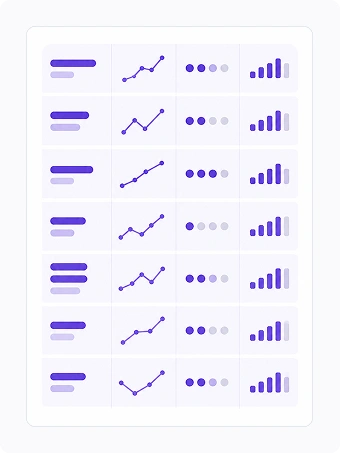
Wireframe illustration of a seven-row comparison table, each row containing a placeholder label bar, a small trend line chart, a three-dot progress indicator, and a small bar chart icon.

Retrieve pre-calculated dividend, return, profitability, risk, and growth metrics for stocks, ETFs, and mutual funds. 

Use it to build stock screeners, asset comparison tables, dividend dashboards, AI company lookup workflows, and portfolio research products.

Typical use:
  • Stock screeners
  • Quality factor analysis
  • Asset comparison tables
  • AI company lookup
  • Dividend dashboards
  • Portfolio research tools

Build Asset Statistics & Risk Dashboards Using Ticker Statistics API

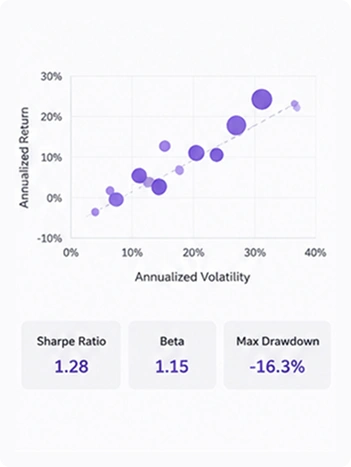
Scatter plot showing Annualized Return (y-axis, -10% to 30%) versus Annualized Volatility (x-axis, 0% to 40%), with bubble points trending upward along a dashed trend line. Below, three metric cards display Sharpe Ratio 1.28, Beta 1.15, and Max Drawdown -16.3%.

Retrieve asset-level statistics, risk metrics, and annual return history for stocks, ETFs, and mutual funds. Ticker Statistics API combines market data, valuation ratios, dividends, analyst targets, trailing performance, category comparisons, risk-adjusted metrics, and calendar-year returns through dedicated endpoints.

Use it to build Statistics & Risk pages, ETF and fund performance dashboards, company statistics views, comparison tables, and research tools.

Typical use:
  • Stock statistics pages
  • Asset comparison tables
  • ETF performance dashboards
  • Category return comparisons
  • Mutual fund risk analysis
  • Research dashboards

Build ETF & Fund Holdings Dashboards Using Holdings API

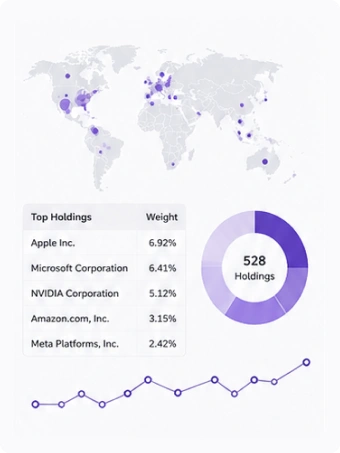
Wireframe illustration showing a world map with purple dots marking locations, a "Top Holdings" table below listing five companies with their weight percentages (6.92% down to 2.42%), a donut chart showing "528 Holdings," and a small line chart at the bottom.

Retrieve ETF and mutual fund holdings data, from high-level allocation and sector exposure to top portfolio positions and full ETF holdings snapshots.

Holdings API helps you build fund composition pages, top holdings tables, sector exposure dashboards, portfolio concentration views, and historical ETF holdings workflows using structured holdings data.

Typical use:
  • ETF holdings pages
  • Sector exposure dashboards
  • Mutual fund holdings pages
  • Portfolio concentration views
  • Top 10 holdings tables
  • ETF holdings history tracking

Build Company Ownership Views Using Ownership Data API

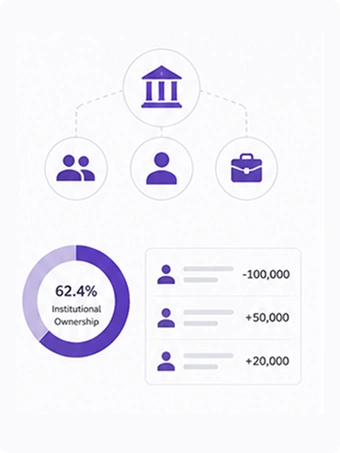
Wireframe illustration with a bank icon connected by dotted lines to three smaller icons (two people, one person, a briefcase), a donut chart below showing 62.4% Institutional Ownership, and a list of three rows with person icons, placeholder text lines, and share change values (-100,000, +50,000, +20,000).

Retrieve institutional ownership, mutual fund holders, insider records, and insider transaction data for publicly traded stocks.

Ownership Data API helps you build company profile sections with major holders, top institutional holders, funds holding the stock, insider roster, and recent insider activity.

Typical use:
  • Company holders sections
  • Insider activity tables
  • Institutional ownership tables
  • Governance transparency views
  • Holder concentration views
  • Mutual fund holder tables

Build Options Chain Dashboards Using Options Analytics API

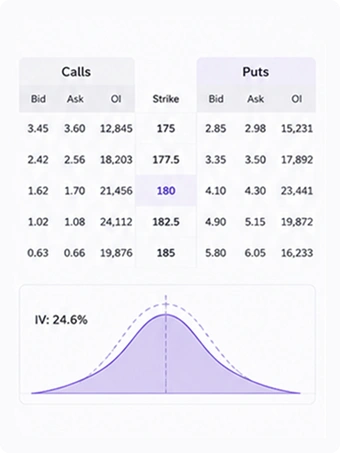
Options chain wireframe showing Calls and Puts tables side by side with Strike prices in the center column (175 to 185), each side listing Bid, Ask, and Open Interest, with the 180 strike highlighted. Below, a bell curve chart labeled "IV: 24.6%" illustrates the implied volatility distribution.

Retrieve options data for stocks and ETFs, including available expiration dates, full options chains, and individual contract details.

Options Analytics API helps you build options chain tables, contract detail pages, volatility views, open interest dashboards, and derivatives analytics workflows using structured options data.

Typical use:
  • Options chain tables
  • Implied volatility views
  • Contract detail pages
  • Open interest tables
  • Expiration date selectors
  • Derivatives analytics tools

Start building with FinImpulse API