


Company Profile API
Description
Company Profile API returns structured company information for stocks, ETFs, and mutual funds. The response includes detailed business descriptions, headquarters and contact information, websites, industry and sector classifications, executive officers, governance metrics, employee counts, investor relations links, and additional profile metadata.
Unlike basic symbol lookup endpoints, Company Profile API provides the information needed to build complete company profile pages, enrich business databases, support AI applications, and power financial research tools from a single API request.
Interface Example
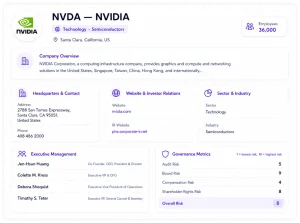
Output Example
NVDA — NVIDIA · Technology · Semiconductors
Santa Clara, California, US · nvidia.com · 36,000 employees
NVIDIA Corporation, a computing infrastructure company, provides graphics and compute, and networking solutions in the United States, Singapore, Taiwan, China, Hong Kong, and internationally…
Executive Officers
- Jen-Hsun Huang — Co-Founder, CEO, President & Director
- Colette M. Kress — Executive VP & CFO
- Debora Shoquist — Executive Vice President of Operations
- Timothy S. Teter — Executive VP, General Counsel & Secretary
- Ajay K. Puri — Executive Vice President of Worldwide Field Operations
Governance Risk Scores
- Audit Risk: 5
- Board Risk: 9
- Compensation Risk: 4
- Shareholder Rights Risk: 8
- Overall Risk: 8
Investor Relations: phx.corporate-ir.net
FARMX — Mutual Fund
Medium · Value style · Morningstar Rating: ★★
Normally the fund allocates at least 80% of assets in securities of agricultural productivity companies… including farm machinery, irrigation, agricultural science and biotechnology, fertilizers, crop chemicals, and livestock services.
Fund Details
- Net Assets: $43.10M
- Yield: 1.53%
- Last Dividend: $0.083
- Last Capital Gain: −$28.00
- Style: Medium / Value
Fees
- Annual Report Expense Ratio: 0.87%
- Net Expense Ratio: 0.87%
- Gross Expense Ratio: 0.87%
- 3-Year Expense Projection: $0
- 5-Year Expense Projection: $0
- 10-Year Expense Projection: $0
Category Comparison
- Front-End Sales Load (category avg.): 4.92%
- Deferred Sales Load (category avg.): 1.29%
- 3-Year Projection (category avg.): $445.01
- 5-Year Projection (category avg.): $732.32
- 10-Year Projection (category avg.): $1,506.03
How to Build this Workflow
This workflow is built using the following FinImpulse APIs
- Company Profile API
- Summary Lite API (optional)
- Market Price API (optional)
- Market News API (optional)
- Financial Statements API (optional)
Resources
Disclaimer. FinImpulse provides financial data and analytics APIs only. AI-generated responses depend on the application, prompts, and language model used. FinImpulse does not provide investment advice, trading recommendations, or guarantee the accuracy of AI-generated conclusions.