Global financial data API for Stocks, ETFs & Funds
Access prices, fundamentals, and long-term datasets in a consistent format across global markets.
One data layer. Two interfaces.
Access the same financial data via API or dashboard.
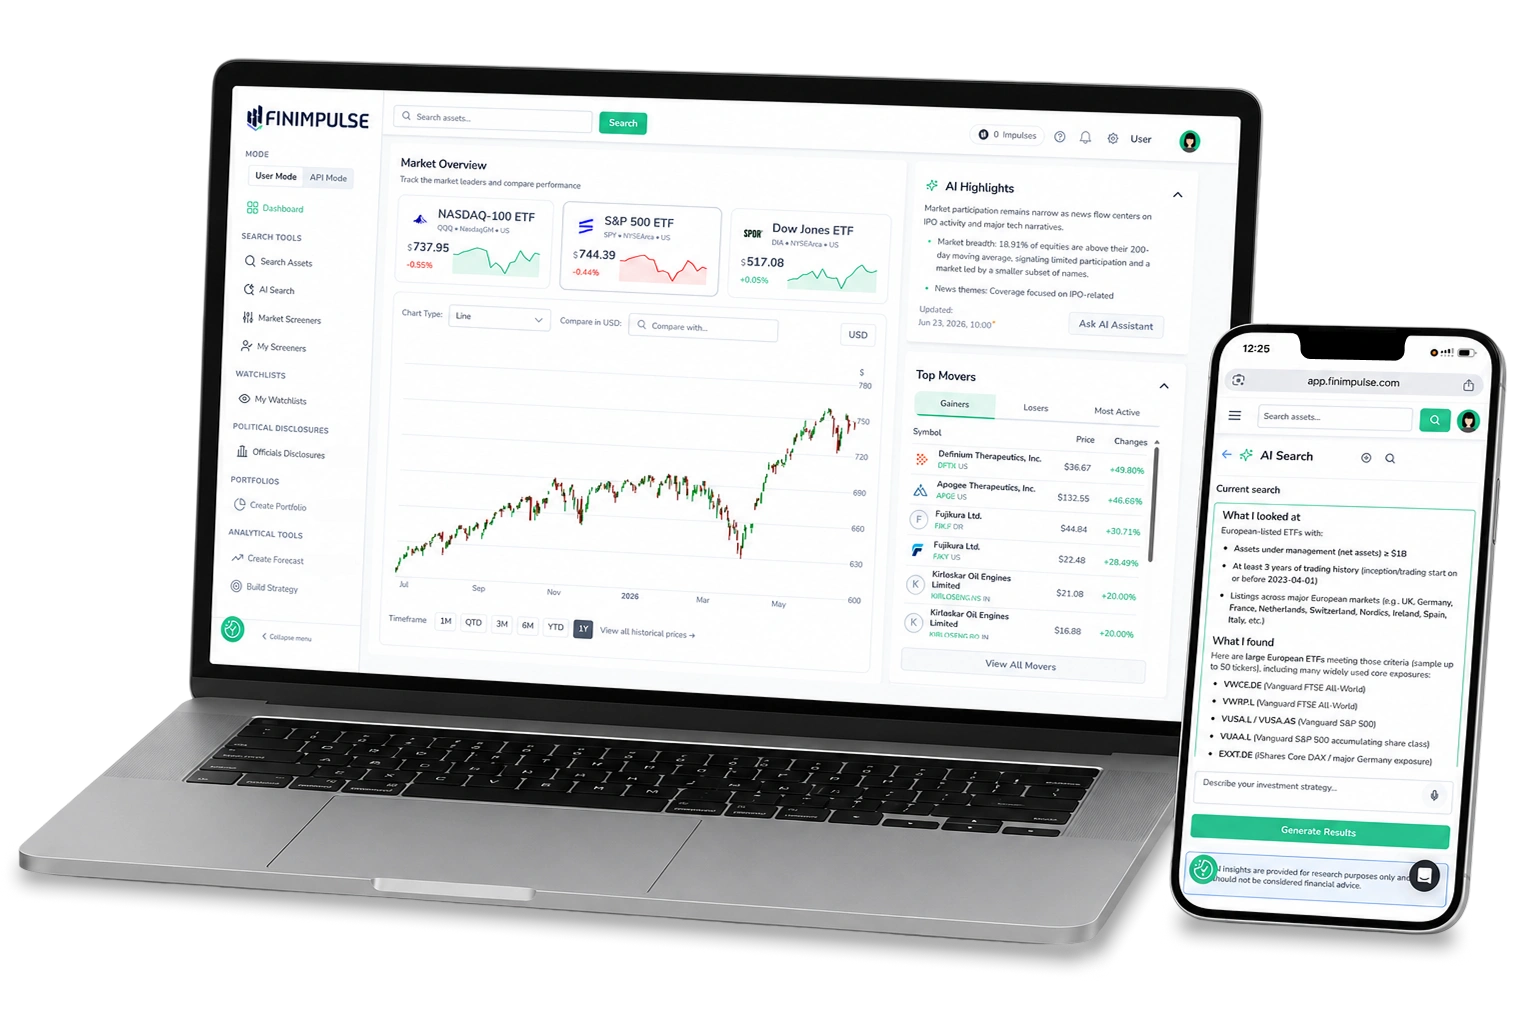
Market Dashboard
Explore and analyze financial data in a visual interface designed for comparison and research
- Search and filter assets across markets
- Compare tickers datasets and key metrics
- Build portfolio, watchlists and screeners
- Use AI search with natural language queries
- Track public officials disclosures
Financial REST API
Access global financial data via REST API for applications, analytics, and internal systems
- Market data across asset classes
- Fundamentals and historical datasets
- Consistent schema across endpoints
- MCP server support for AI workflows
- Integrations with n8n, Make, and internal systems
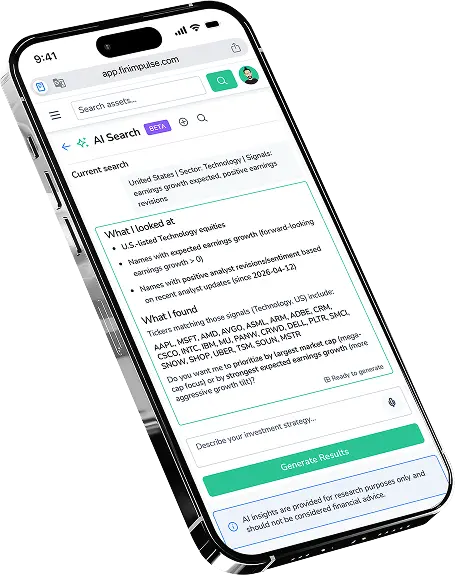
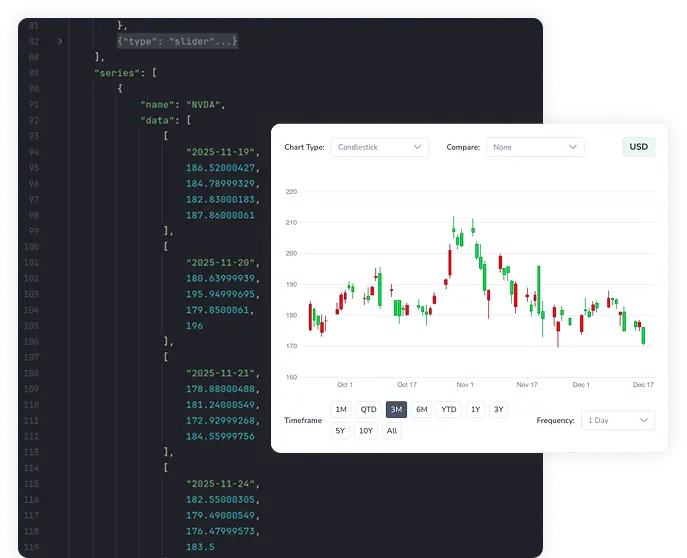
Explore financial data with AI
Ask questions in any language — the system understands queries and returns structured results across global datasets.
AI Search works across datasets, markets, and asset classes.
Instead of configuring filters, you describe what you need — your request is mapped to structured financial data with consistent results.
You can search by fundamentals, analyst signals, holdings, or any combination of metrics — including conditions not available in predefined screeners.
Financial filters
Find companies by balance sheet values, margins, or growth ranges
Analyst signals
Identify assets based on price targets or rating trends and signals
Fund exposure
Find funds with exposure to selected sectors, assets, or regions
Market Queries
Combine fundamentals, prices, and historical data in a single query
Metric Relations
Compare growth, profitability, and risk across asset groups

Global coverage across asset classes
Stocks, ETFs, and mutual funds across international markets with long-term history and unified pricing
Stocks
Public companies across global exchanges
Financials, performance, and ownership
ETFs
ETF datasets with holdings and structure
Allocation details and fund composition
Mutual Funds
Fund datasets with NAV and composition
Performance and allocation details
Cross-Market Analysis in Dashboard
Compare assets across regions, exchanges, and currencies in a unified structure
Analyze performance, pricing, and key metrics in a single view
Financial datasets ready to use
Standardized data for analysis, applications, and internal workflows
Prices
OHLC prices, dividends, and pricing history across global markets
Asset Profiles
Asset profiles with sector, industry, and classification data
Financial Statements
Income statements, balance sheets, and cash flow data
Metrics & Indicators
Margins, growth metrics, and indicators such as ROE and ROIC
Holdings & Composition
ETF and fund holdings, weights, sector exposure, and allocation breakdowns
Analyst & Insider Data
Earnings estimates, analyst coverage, rating history, and insider disclosures
News
News and press releases linked to assets across stocks, ETFs, and mutual funds
Options Data
Option expirations, chains, pricing, open interest, and contract-level data
One platform for financial data and workflows
Use FinImpulse instead of separate APIs, dashboards, and automation tools
API Data Layer
Access structured financial data across markets, asset classes, and datasets
Automation & Integrations
Connect data to workflows using API, n8n, Make, and other tools
Analysis Dashboard
Explore, compare, and analyze financial data in a visual interface