

ETF Holdings Dashboard
Description
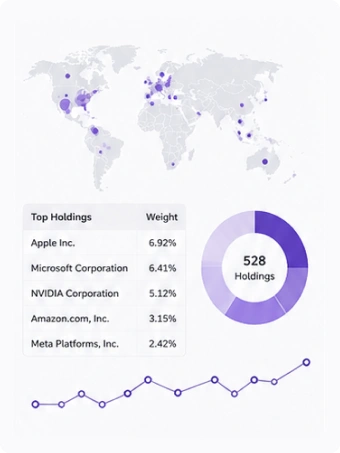
Build ETF holdings dashboards with allocation breakdowns, sector exposure, holdings-weighted valuation metrics, and the largest underlying positions.
This workflow is designed for ETF profile pages, fund comparison tools, portfolio composition views, and research dashboards. It helps users understand how an ETF is constructed, which sectors it is exposed to, how concentrated it is, and which securities drive the largest share of the portfolio.
Use Holdings Overview for high-level allocation and sector data, then add Top 10 Holdings to show the largest positions with weights, allocation percentages, and market values.
Interface Example
Output Example
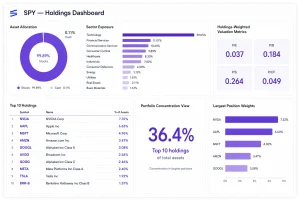
Asset Allocation
- Stocks: 99.89%
- Cash: 0.11%
- Bonds/Other: 0%
Sector Exposure
- Technology: 39.05%
- Financial Services: 11.07%
- Communication Services: 10.64%
- Consumer Cyclical: 9.89%
- Healthcare: 8.30%
- Industrials: 7.82%
- Consumer Defensive: 4.50%
- Energy: 3.13%
- Utilities: 2.11%
- Basic Materials: 1.67%
- Real Estate: 1.81%
Top 10 Holdings
|
Symbol |
Name |
% of Assets |
|---|---|---|
|
NVDA |
NVIDIA Corp |
7.32% |
|
AAPL |
Apple Inc |
6.63% |
|
MSFT |
Microsoft Corp |
4.96% |
|
AMZN |
Amazon.com Inc |
3.47% |
|
GOOGL |
Alphabet Inc Class A |
3.08% |
|
AVGO |
Broadcom Inc |
2.56% |
|
GOOG |
Alphabet Inc Class C |
2.46% |
|
META |
Meta Platforms Inc Class A |
2.40% |
|
TSLA |
Tesla Inc |
1.92% |
|
BRK-B |
Berkshire Hathaway Inc Class B |
1.57% |
How to Build this Workflow
This workflow is built using the following FinImpulse APIs
- Holdings Overview API
- Top 10 Holdings API
- Summary API (optional)
- Profile API (optional)
- Historical Prices API (optional)
Resources
Disclaimer. FinImpulse provides financial data and analytics APIs only. AI-generated responses depend on the application, prompts, and language model used. FinImpulse does not provide investment advice, trading recommendations, or guarantee the accuracy of AI-generated conclusions.
Mutual Fund Holdings Dashboard
Description
Build mutual fund holdings dashboards with portfolio allocation, sector exposure, holdings-derived valuation metrics, and the largest fund positions.
This workflow is designed for mutual fund profile pages, fund research tools, comparison tables, and portfolio analysis products. It helps users review how a fund allocates capital, which sectors it is exposed to, and which underlying securities have the largest weight in the portfolio.
Use Holdings Overview to display the fund’s portfolio composition and exposure breakdowns, then use Top 10 Holdings to show the largest disclosed positions. This keeps the workflow lightweight while still giving a clear view of fund composition.
Interface Example
Output Example
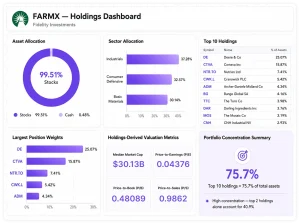
Asset Allocation
- Stocks: 99.51%
- Cash: 0.48%
- Bonds/Other: 0%
Sector Exposure
- Industrials: 37.28%
- Consumer Defensive: 32.57%
- Basic Materials: 30.14%
Fund Size Characteristics
- Median Market Cap: $30.13B
Top 10 Holdings
|
Symbol |
Name |
% of Assets |
|---|---|---|
|
DE |
Deere & Co |
25.07% |
|
CTVA |
Corteva Inc |
15.87% |
|
NTR.TO |
Nutrien Ltd |
7.41% |
|
CWK.L |
Cranswick PLC |
5.42% |
|
ADM |
Archer-Daniels-Midland Co |
4.34% |
|
BG |
Bunge Global SA |
4.16% |
|
TTC |
The Toro Co |
3.98% |
|
DAR |
Darling Ingredients Inc |
3.76% |
|
MOS |
The Mosaic Co |
3.19% |
|
CNH |
CNH Industrial NV |
2.93% |
How to Build this Workflow
This workflow is built using the following FinImpulse APIs
- Holdings Overview API
- Top 10 Holdings API
- Summary API (optional)
- Profile API (optional)
- Historical Prices API (optional)
Resources
Disclaimer. FinImpulse provides financial data and analytics APIs only. AI-generated responses depend on the application, prompts, and language model used. FinImpulse does not provide investment advice, trading recommendations, or guarantee the accuracy of AI-generated conclusions.
ETF Full Holdings History
Description
Build ETF holdings and historical composition tools using reporting dates and full holdings snapshots.
This workflow is designed for applications that need more than a top 10 holdings table. It can support full ETF holdings pages, holdings overlap analysis, position-level screening, exposure monitoring, AI workflows, and historical composition tracking.
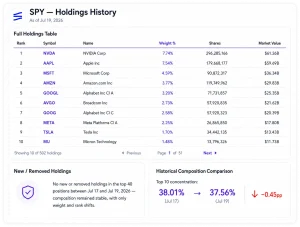
Use Holdings Reporting Dates to retrieve available reporting dates for a selected ETF, then use All Holdings List to load the full portfolio composition for a chosen date. This makes it possible to compare ETF holdings across reporting periods, detect changes in position weights, and analyze how fund composition evolves over time.
Historical holdings workflow is ETF-only; mutual funds are not supported for this full-history endpoint.
Interface Example
Output Example
July 17, 2026
|
#* |
Symbol |
Name |
Weight |
Shares |
Market Value |
|---|---|---|---|---|---|
|
1 |
NVDA |
NVIDIA Corp |
7.89% |
295,372,891 |
$62.55B |
|
2 |
AAPL |
Apple Inc |
7.37% |
179,114,962 |
$58.46B |
|
3 |
MSFT |
Microsoft Corp |
4.50% |
90,592,557 |
$35.72B |
|
4 |
AMZN |
Amazon.com Inc |
3.82% |
119,381,282 |
$30.33B |
|
5 |
GOOGL |
Alphabet Inc Cl A |
3.33% |
71,510,987 |
$26.43B |
|
6 |
AVGO |
Broadcom Inc |
2.86% |
57,742,540 |
$22.69B |
|
7 |
GOOG |
Alphabet Inc Cl C |
2.68% |
57,642,288 |
$21.27B |
|
8 |
META |
Meta Platforms Cl A |
2.29% |
26,783,170 |
$18.19B |
|
9 |
TSLA |
Tesla Inc |
1.70% |
34,336,120 |
$13.50B |
|
10 |
MU |
Micron Technology |
1.56% |
13,753,881 |
$12.39B |
|
11 |
JPM |
JPMorgan Chase & Co |
1.42% |
32,680,968 |
$11.30B |
|
12 |
LLY |
Eli Lilly & Co |
1.40% |
9,648,136 |
$11.12B |
|
13 |
AMD |
Advanced Micro Devices |
1.32% |
19,887,813 |
$10.49B |
|
14 |
XOM |
ExxonMobil Holdings |
0.92% |
50,558,267 |
$7.28B |
|
15 |
JNJ |
Johnson & Johnson |
0.91% |
29,361,526 |
$7.23B |
|
16 |
V |
Visa Inc Class A |
0.90% |
20,245,277 |
$7.17B |
|
17 |
WMT |
Walmart Inc |
0.76% |
53,478,498 |
$6.00B |
|
18 |
INTC |
Intel Corp |
0.75% |
57,627,170 |
$5.91B |
|
19 |
AMAT |
Applied Materials |
0.70% |
9,680,497 |
$5.59B |
|
20 |
CSCO |
Cisco Systems Inc |
0.68% |
48,151,580 |
$5.36B |
*showing 20 of 502 holdings
How to Build this Workflow
This workflow is built using the following FinImpulse APIs
- Holdings Reporting Dates API
- All Holdings List API
- Holdings Overview API (optional)
- Top 10 Holdings API (optional)
- Market Price API (optional)
- Historical Prices API (optional)
Resources
Disclaimer. FinImpulse provides financial data and analytics APIs only. AI-generated responses depend on the application, prompts, and language model used. FinImpulse does not provide investment advice, trading recommendations, or guarantee the accuracy of AI-generated conclusions.