

Stock Statistics Dashboard
Description
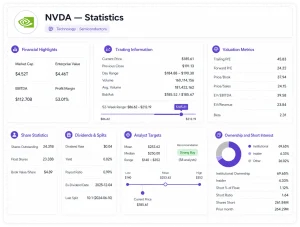
Build stock statistics pages with company-level market data, valuation ratios, dividend fields, profitability metrics, balance sheet indicators, share statistics, short interest, ownership data, and analyst target fields from a single statistics snapshot.
This workflow is designed for stock detail pages, company statistics tabs, comparison tables, research dashboards, and AI assistants that need a broad view of a company’s financial and market profile. It can help users review metrics such as market cap, trailing P/E, price-to-sales, price-to-book, enterprise value, margins, ROE, ROA, debt-to-equity, cash, revenue, free cash flow, dividend yield, short interest, and analyst target prices.
Use it when your application needs a compact yet detailed stock statistics layer without separately requesting financial statements, price history, dividends, analyst data, and ownership fields.
Interface Example
Output Example
Price & Market Data
- Current Price: $185.61
- Previous Close: $191.13
- 52-Week Range: $86.62 – $212.19
- 50-Day Avg: $183.90
- 200-Day Avg: $168.12
Valuation
- Market Cap: $4.52T
- Enterprise Value: $4.46T
- Trailing P/E: 45.83
- Forward P/E: 24.22
- Price/Book: 37.94
- Price/Sales: 24.15
- EV/EBITDA: 39.58
- Beta: 2.31
Dividends
- Dividend Rate: $0.04
- Dividend Yield: 0.02%
- Payout Ratio: 0.99%
Profitability
- Profit Margin: 53.01%
- Gross Margin: 70.05%
- Operating Margin: 63.17%
- ROE: 107.36%
- ROA: 53.53%
Balance Sheet
- Total Cash: $60.61B
- Total Debt: $10.82B
- Debt/Equity: 9.10
- Current Ratio: 4.47
Ownership & Short Interest
- Institutional Ownership: 69.65%
- Insider Ownership: 4.33%
- Short % of Float: 1.12%
- Short Ratio: 1.64
Analyst Targets
- Target Mean: $253.62
- Range: $140 – $352
- Recommendation: Strong Buy (58 analysts)
How to Build this Workflow
This workflow is built using the following FinImpulse APIs
- Statistics Snapshot API
- Company Profile API (optional)
- Market Price API (optional)
- Financial Statements API (optional)
- Market News API (optional)
Resources
Disclaimer. FinImpulse provides financial data and analytics APIs only. AI-generated responses depend on the application, prompts, and language model used. FinImpulse does not provide investment advice, trading recommendations, or guarantee the accuracy of AI-generated conclusions.
ETF Performance & Risk Dashboard
Description
Build ETF performance and statistics dashboards with price data, category information, trailing returns, distribution fields, annual return history, quarterly returns, and risk metrics where available.
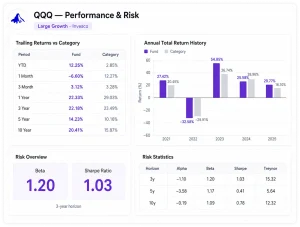
This workflow is useful for ETF research pages, performance dashboards, category comparison tools, portfolio analytics, and ETF discovery products. It can support views such as trailing returns vs category, total returns, annual return history, quarterly return history, risk overview, and benchmark-style performance comparison.
Use it when your application needs to show how an ETF performed across different time periods, how it compares with its category, and how its return history looks over multiple years. Statistics Snapshot gives the current and trailing performance context, while Annual Return History adds structured historical return tables for charting and comparison.
Interface Example
Output Example
Price & Fund Info
- Previous Close: $747.03
- Day Range: $748.80 – $758.58
- 52-Week Range: $625.58 – $760.40
- All-Time High: $760.40
- Category: Large Blend
- Fund Family: State Street Investment Management
- Trailing Annual Dividend Yield: 0.76%
Trailing Returns (Fund vs. Category)
|
Period |
Fund |
Category |
|---|---|---|
|
YTD |
10.16% |
5.14% |
|
1 Month |
−0.96% |
9.43% |
|
3 Month |
15.17% |
3.42% |
|
1 Year |
22.20% |
27.72% |
|
3 Year |
20.48% |
19.34% |
|
5 Year |
13.30% |
11.20% |
|
10 Year |
15.40% |
13.77% |
Risk Metrics (Standardized Horizons)
|
Horizon |
Alpha |
Beta |
Std Dev |
Sharpe |
Treynor |
|---|---|---|---|---|---|
|
3y |
−1.58 |
0.98 |
— |
1.03 |
14.75 |
|
5y |
−1.39 |
0.96 |
— |
0.53 |
7.79 |
|
10y |
−1.07 |
0.98 |
— |
0.76 |
11.58 |
Annual Return History (Recent Years)
|
Year |
Fund |
Category |
|---|---|---|
|
2021 |
+28.75% |
+26.07% |
|
2022 |
−18.17% |
−16.96% |
|
2023 |
+26.19% |
+22.32% |
|
2024 |
+24.89% |
+21.45% |
|
2025 |
+17.72% |
+15.54% |
How to Build this Workflow
This workflow is built using the following FinImpulse APIs
- Statistics Snapshot API
- Annual Return History API
- Risk & Factor Metrics API (optional)
- Summary API (optional)
- Historical Prices API (optional)
- Holdings API (optional)
Resources
Disclaimer. FinImpulse provides financial data and analytics APIs only. AI-generated responses depend on the application, prompts, and language model used. FinImpulse does not provide investment advice, trading recommendations, or guarantee the accuracy of AI-generated conclusions.
Mutual Fund Performance & Risk Dashboard
Description
Build mutual fund performance and risk dashboards with trailing returns, category returns, load-adjusted returns, annual return history, quarterly returns, fund rankings, years up/down, and risk-adjusted performance metrics.
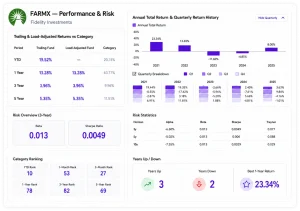
This workflow is designed for mutual fund research platforms, fund comparison tools, portfolio analytics, risk dashboards, and applications that need category-relative fund performance data. It can support views such as trailing and load-adjusted returns vs category, annual total return history, quarterly return history, rank in category, risk overview, and risk statistics.
Use it when your product needs a deeper fund analytics layer than a simple price or NAV snapshot. Mutual funds can use the full Statistics & Risk flow: Statistics Snapshot for fund performance and category fields, Annual Return History for multi-year and quarterly returns, and Risk & Factor Metrics for alpha, beta, R-squared, standard deviation, Sharpe ratio, and Treynor ratio across available time periods.
Interface Example
Output Example
Price & Fund Info
- Previous Close: $21.78
- 52-Week Range: $17.84 – $22.72
- 50-Day Avg: $21.68
- 200-Day Avg: $20.66
- Fund Family: Fidelity Investments
Trailing Returns (Fund vs. Category)
|
Period |
Fund |
Category |
|---|---|---|
|
YTD |
19.52% |
20.74% |
|
1 Month |
−0.58% |
−1.94% |
|
3 Month |
−2.33% |
7.31% |
|
1 Year |
13.28% |
63.77% |
|
3 Year |
3.96% |
9.96% |
|
5 Year |
5.35% |
11.51% |
Category Ranking
- YTD Rank: 10
- 1-Year Rank: 78
- 3-Year Rank: 82
- 5-Year Rank: 69
- Years Up: 3
- Years Down: 2
- Best 1-Year Return: 23.34%
Risk Metrics (Standardized Horizons)
|
Horizon |
Alpha |
Beta |
Std Dev |
Sharpe |
Treynor |
|---|---|---|---|---|---|
|
3y |
−6.60% |
0.013 |
26.43% |
0.005 |
0.077 |
|
5y |
−5.02% |
0.013 |
21.92% |
0.006 |
0.088 |
|
10y |
−7.55% |
0.013 |
22.19% |
0.003 |
0.029 |
Annual Return History (Recent Years)
|
Year |
Annual Return |
|---|---|
|
2021 |
+23.34% |
|
2022 |
+13.69% |
|
2023 |
−11.60% |
|
2024 |
−4.85% |
|
2025 |
+8.00% |
How to Build this Workflow
This workflow is built using the following FinImpulse APIs
- Statistics Snapshot API
- Risk & Factor Metrics API
- Annual Return History API
- Summary API (optional)
- Profile API (optional)
- Holdings API (optional)
- Historical Prices API (optional)
Resources
Disclaimer. FinImpulse provides financial data and analytics APIs only. AI-generated responses depend on the application, prompts, and language model used. FinImpulse does not provide investment advice, trading recommendations, or guarantee the accuracy of AI-generated conclusions.