

Summary Lite API
Description
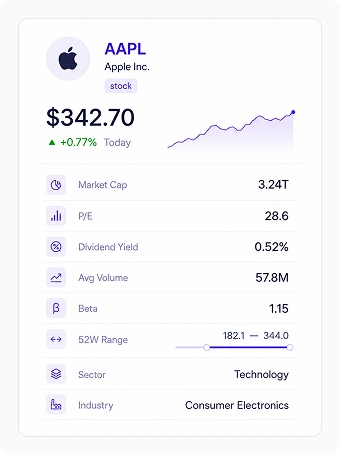
Summary Lite API returns a compact company or fund snapshot with the fields most applications need for quick asset identification and overview screens. It includes symbol, display name, quote type, logo, sector, industry, country, city, website, employee count, current price, USD price fields, 52-week range, dividends, average volume, market capitalization, beta, and core valuation ratios.
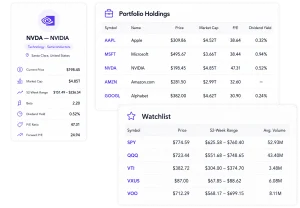
Use it to power company cards, portfolio holdings, watchlists, asset preview panels, onboarding flows, AI company lookup, and lightweight overview pages. It is designed for fast, low-cost requests when you need enough context to show what an asset is, how it is priced, and how it is valued without loading a full research dataset.
Interface Example
Output Example
NVDA — NVIDIA · Technology · Semiconductors
- Current Price: $198.45
- Regular Market Price: $200.09
- Post-Market Price: $199.53
- 52-Week Range: $151.49 – $236.54
- Market Cap: $4.85T
- Beta: 2.20
- Dividend Yield: 0.52%
- Average Volume: 161.5M
- P/E Ratio: 47.31
- Forward P/E: 24.94
- P/B Ratio: 39.07
- P/S Ratio: 25.11
How to Build this Workflow
This workflow is built using the following FinImpulse APIs
- Summary Lite API
- Search Lite API (optional)
- Market Price API (optional)
- Historical Prices API (optional)
Resources
API Cost Examples
| Scenario | APIs Used | Usage Example | Estimated Monthly Cost |
|---|---|---|---|
| Watchlists | Summary Lite API | 100,000 requests | ≈ $20.00 |
| Summary Lite API = $0.00020 100,000 requests × $0.00020 = $20.00 / month |
|||
| Portfolio Holdings | Summary Lite API | 500,000 requests | ≈ $100.00 |
| Summary Lite API = $0.00020 500,000 requests × $0.00020 = $100.00 / month |
|||
| AI Company Lookup | Summary Lite API | 1,000,000 requests | ≈ $200.00 |
| Summary Lite API = $0.00020 1,000,000 requests × $0.00020 = $200.00 / month |
|||
Disclaimer. The pricing examples above are calculated using the APIs shown in this workflow and represent typical usage scenarios. Static data can be cached client-side to reduce actual costs below these estimates, and the Sandbox environment is available for development and testing separately from production usage. Actual costs depend on the endpoints, datasets, response size, request frequency, caching strategy, and additional data included in your application.
FinImpulse provides financial data and analytics APIs only. AI-generated responses depend on the application, prompts, and language model used. FinImpulse does not provide investment advice, trading recommendations, or guarantee the accuracy of AI-generated conclusions.
Summary API
Description
Summary API returns a deeper structured snapshot for stocks and other supported assets. It includes company profile data, address and contact details, business description, sector and industry classification, pricing, market range, volume, bid/ask data, dividends, valuation ratios, enterprise value, share statistics, short interest, ownership, fiscal dates, earnings data, analyst targets, recommendation data, profitability, balance sheet highlights, cash flow metrics, margins, governance risk, insider activity, and fund-specific fields when available.
Summary API is better when your product needs a broad company-level dataset in one request instead of combining multiple smaller endpoints. Use it to build full asset overview pages, research dashboards, AI analyst summaries, company profile screens, valuation panels, dividend blocks, ownership views, profitability cards, and financial snapshot pages.
Interface Example
Output Example
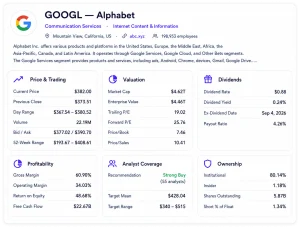
NVDA — NVIDIA · Technology · Semiconductors
Price & Trading
- Current Price: $209.73
- Previous Close: $204.87
- Day Range: $203.44 – $207.07
- Volume: 93.05M
- Bid / Ask: $205.09 / $205.17
Valuation
- Market Cap: $5.02T
- Trailing P/E: 31.37
- Forward P/E: 16.12
- Price/Sales: 19.60
- Price/Book: 25.42
- Enterprise Value: $4.92T
Profitability
- Gross Margin: 74.14%
- Operating Margin: 65.60%
- Return on Equity: 114.29%
- Free Cash Flow: $46.34B
Analyst Coverage
- Recommendation: Strong Buy (59 analysts)
- Target Mean: $298.93
- Target Range: $180 – $500
Ownership
- Institutional Ownership: 70.86%
- Insider Ownership: 3.98%
- Shares Outstanding: 24.22B
How to Build this Workflow
This workflow is built using the following FinImpulse APIs
- Summary API
- Search Lite API (optional)
- Market Price API (optional)
- Historical Prices API (optional)
Resources
API Cost Examples
| Scenario | APIs Used | Usage Example | Estimated Monthly Cost |
|---|---|---|---|
| Company Profile Pages | Summary API | 10,000 summary requests | ≈ $23.00 |
| Summary API = $0.00230 10,000 requests × $0.00230 = $23.00 / month |
|||
| Research Dashboard | Summary API | 50,000 summary requests | ≈ $115.00 |
| Summary API = $0.00230 50,000 requests × $0.00230 = $115.00 / month |
|||
| AI Company Reports | Summary API | 100,000 summary requests | ≈ $230.00 |
| Summary API = $0.00230 100,000 requests × $0.00230 = $230.00 / month |
|||
| Portfolio Management System | Summary API | 250,000 summary requests | ≈ $575.00 |
| Summary API = $0.00230 250,000 requests × $0.00230 = $575.00 / month |
|||
Disclaimer. The pricing examples above are calculated using the APIs shown in this workflow and represent typical usage scenarios. Static data can be cached client-side to reduce actual costs below these estimates, and the Sandbox environment is available for development and testing separately from production usage. Actual costs depend on the endpoints, datasets, response size, request frequency, caching strategy, and additional data included in your application.
FinImpulse provides financial data and analytics APIs only. AI-generated responses depend on the application, prompts, and language model used. FinImpulse does not provide investment advice, trading recommendations, or guarantee the accuracy of AI-generated conclusions.