
 Claude Desktop
 Cline
 Antigravity CLI
 Claude Code
 ChatGPT
 Cursor
 VS Code (Copilot)
 Windsurf
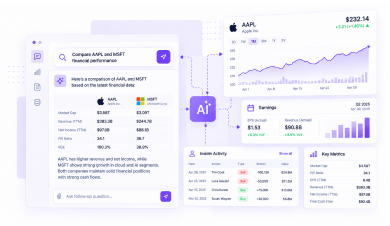
AI-Powered Research
Compare companies, review earnings, and investigate insider activity using structured financial data in your AI client.
- MCP
- AI Agents
Access market prices, company financials, ETF holdings, and more through FinImpulse MCP. Bring structured financial data into AI-powered research, analysis, and automated workflows.
Use FinImpulse with MCP-compatible AI assistants and development environments, including Claude, ChatGPT, Cursor, Gemini CLI, and VS Code.
See how AI agents use FinImpulse MCP to answer questions about company performance, historical prices, and ETF holdings. Choose an example to explore the results.
Example prompt: Show Apple’s revenue, operating income and net income for recent annual periods.
| Fiscal year | Revenue | Operating income | Net income | Operating margin | Net margin |
|---|---|---|---|---|---|
| FY2022 | $394.3B | $119.4B | $99.8B | 30.3% | 25.3% |
| FY2023 | $383.3B | $114.3B | $97.0B | 29.8% | 25.3% |
| FY2024 | $391.0B | $123.2B | $93.7B | 31.5% | 24.0% |
| FY2025 | $416.2B | $133.1B | $112.0B | 32.0% | 26.9% |
Apple’s fiscal year ends in September. Figures are rounded to $0.1 billion.
Example prompt: Show daily historical OHLCV prices for AAPL over the last five trading sessions.
| Session | Open | High | Low | Close | Volume |
|---|---|---|---|---|---|
| Oct 22, 2026 | $344.94 | $348.36 | $342.28 | $348.22 | 46,718,600 |
| Oct 21, 2026 | $339.36 | $345.25 | $338.83 | $343.99 | 35,577,700 |
| Oct 20, 2026 | $339.86 | $343.06 | $338.70 | $339.50 | 35,764,400 |
| Oct 19, 2026 | $340.78 | $346.00 | $340.12 | $342.94 | 34,547,800 |
| Oct 16, 2026 | $346.09 | $347.82 | $340.46 | $343.48 | 59,895,300 |
Example prompt: Find ETFs that include NVIDIA (NVDA) among their top holdings and show NVIDIA’s portfolio weight in each fund
| ETF | Fund name | NVIDIA portfolio weight |
|---|---|---|
| VGT | Vanguard Information Technology ETF | 17.74% |
| VUG | Vanguard Growth ETF | 13.62% |
| SPY | SPDR S&P 500 ETF Trust | 8.36% |
| QQQ | Invesco QQQ Trust | 8.33% |
| VTI | Vanguard Total Stock Market ETF | 6.87% |
Holdings shown are from the returned top-holdings data, not a complete ETF universe.
Retrieved Oct 23, 2026 · Snapshot dates not provided
Example prompt: Compare Apple and Microsoft revenue, net income, and operating margins over the last 5 fiscal years.
| Fiscal year | Apple revenue | Microsoft revenue | Apple net income | Microsoft net income | Apple op. margin | Microsoft op. margin |
|---|---|---|---|---|---|---|
| FY2021 | $365.8B | $168.1B | $94.7B | $61.3B | 29.8% | 41.6% |
| FY2022 | $394.3B | $198.3B | $99.8B | $72.7B | 30.3% | 42.1% |
| FY2023 | $383.3B | $211.9B | $97.0B | $72.4B | 29.8% | 41.8% |
| FY2024 | $391.0B | $245.1B | $93.7B | $88.1B | 31.5% | 44.6% |
| FY2025 | $416.2B | $281.7B | $112.0B | $101.8B | 32.0% | 45.6% |
Apple’s fiscal year ends in September; Microsoft’s ends in June. Fiscal-year labels are not aligned calendar periods.
Explore real-time US market data, global historical prices, financial statements, earnings, ETF holdings, financial news, insider transactions, and SEC filings through FinImpulse MCP.
Nasdaq · Equity · USD · illustrative snapshot
| TIME (ET) | OPEN | HIGH | LOW | CLOSE | VOLUME |
|---|---|---|---|---|---|
| 15:55 | $219.40 | $219.85 | $219.20 | $219.75 | 2.18M |
| 15:50 | $218.90 | $219.45 | $218.75 | $219.35 | 1.72M |
| 15:45 | $218.50 | $219.10 | $218.30 | $218.95 | 1.59M |
| 15:40 | $218.15 | $218.60 | $218.00 | $218.45 | 1.41M |
| 15:35 | $217.80 | $218.30 | $217.65 | $218.10 | 1.35M |
{
  "summary_cards": [
    {
      "label": "LAST PRICE",
      "value": "$219.75"
    },
    {
      "label": "CHANGE",
      "value": "+0.83%",
      "is_positive": true
    },
    {
      "label": "SESSION VOLUME",
      "value": "84.54M"
    },
    {
      "label": "SESSION HIGH",
      "value": "$222.19"
    }
  ],
  "chart": {
    "title": "Intraday price movement",
    "labels": [
      "9:30",
      "11:00",
      "12:30",
      "14:00",
      "16:00"
    ],
    "points": [
      215.5,
      216.8,
      218.4,
      217.9,
      219.75
    ]
  },
  "table": {
    "columns": [
      {
        "key": "time",
        "label": "TIME (ET)"
      },
      {
        "key": "open",
        "label": "OPEN"
      },
      {
        "key": "high",
        "label": "HIGH"
      },
      {
        "key": "low",
        "label": "LOW"
      },
      {
        "key": "close",
        "label": "CLOSE"
      },
      {
        "key": "volume",
        "label": "VOLUME"
      }
    ],
    "rows": [
      {
        "time": "15:55",
        "open": "$219.40",
        "high": "$219.85",
        "low": "$219.20",
        "close": "$219.75",
        "volume": "2.18M"
      },
      {
        "time": "15:50",
        "open": "$218.90",
        "high": "$219.45",
        "low": "$218.75",
        "close": "$219.35",
        "volume": "1.72M"
      },
      {
        "time": "15:45",
        "open": "$218.50",
        "high": "$219.10",
        "low": "$218.30",
        "close": "$218.95",
        "volume": "1.59M"
      },
      {
        "time": "15:40",
        "open": "$218.15",
        "high": "$218.60",
        "low": "$218.00",
        "close": "$218.45",
        "volume": "1.41M"
      },
      {
        "time": "15:35",
        "open": "$217.80",
        "high": "$218.30",
        "low": "$217.65",
        "close": "$218.10",
        "volume": "1.35M"
      }
    ]
  }
}Global equities · Daily adjusted price history
| DATE | OPEN | HIGH | LOW | CLOSE | VOLUME |
|---|---|---|---|---|---|
| Oct 27, 2026 | $218.31 | $219.19 | $215.53 | $217.94 | 84,542,200 |
| Oct 26, 2026 | $213.11 | $217.75 | $212.61 | $216.00 | 90,493,500 |
| Oct 23, 2026 | $210.99 | $213.85 | $210.18 | $210.96 | 79,987,200 |
| Oct 22, 2026 | $217.13 | $218.88 | $211.26 | $212.21 | 124,816,000 |
| Oct 21, 2026 | $220.96 | $222.19 | $217.66 | $221.97 | 86,620,400 |
| Oct 20, 2026 | $215.98 | $218.46 | $212.77 | $216.47 | 78,967,900 |
| Oct 19, 2026 | $218.10 | $219.62 | $214.70 | $217.09 | 98,403,300 |
{
  "features": [
    {
      "label": "30+ years",
      "description": "available for selected symbols"
    },
    {
      "label": "Daily OHLCV",
      "description": "open, high, low, close, volume"
    },
    {
      "label": "Corporate actions",
      "description": "dividends and splits, where available"
    }
  ],
  "chart": {
    "title": "Historical closing prices (1-Year Range)",
    "labels": [
      "Oct 25",
      "Dec 25",
      "Feb 26",
      "Apr 26",
      "Jun 26",
      "Aug 26",
      "Oct 26"
    ],
    "points": [
      135.2,
      148.8,
      168.1,
      184.3,
      201.5,
      214.8,
      217.94
    ]
  },
  "table": {
    "columns": [
      {
        "key": "date",
        "label": "DATE"
      },
      {
        "key": "open",
        "label": "OPEN"
      },
      {
        "key": "high",
        "label": "HIGH"
      },
      {
        "key": "low",
        "label": "LOW"
      },
      {
        "key": "close",
        "label": "CLOSE"
      },
      {
        "key": "volume",
        "label": "VOLUME"
      }
    ],
    "rows": [
      {
        "date": "Oct 27, 2026",
        "open": "$218.31",
        "high": "$219.19",
        "low": "$215.53",
        "close": "$217.94",
        "volume": "84,542,200"
      },
      {
        "date": "Oct 26, 2026",
        "open": "$213.11",
        "high": "$217.75",
        "low": "$212.61",
        "close": "$216.00",
        "volume": "90,493,500"
      },
      {
        "date": "Oct 23, 2026",
        "open": "$210.99",
        "high": "$213.85",
        "low": "$210.18",
        "close": "$210.96",
        "volume": "79,987,200"
      },
      {
        "date": "Oct 22, 2026",
        "open": "$217.13",
        "high": "$218.88",
        "low": "$211.26",
        "close": "$212.21",
        "volume": "124,816,000"
      },
      {
        "date": "Oct 21, 2026",
        "open": "$220.96",
        "high": "$222.19",
        "low": "$217.66",
        "close": "$221.97",
        "volume": "86,620,400"
      },
      {
        "date": "Oct 20, 2026",
        "open": "$215.98",
        "high": "$218.46",
        "low": "$212.77",
        "close": "$216.47",
        "volume": "78,967,900"
      },
      {
        "date": "Oct 19, 2026",
        "open": "$218.10",
        "high": "$219.62",
        "low": "$214.70",
        "close": "$217.09",
        "volume": "98,403,300"
      }
    ]
  }
}Nasdaq · Common stock · United States
| Ticker | NVDA |
|---|---|
| Exchange | Nasdaq |
| Sector | Technology |
| Industry | Semiconductors |
| Country | United States |
| Currency | USD |
| Market cap | $5.26T |
|---|---|
| Trailing P/E | 30.74 |
| 52-week high | $237.07 |
| 52-week low | $118.00 |
| Dividend yield | 0.08% |
| Shares outstanding | 24.5B |
{
  "sections": [
    {
      "section_title": "Company profile",
      "items": [
        {
          "field": "Ticker",
          "value": "NVDA"
        },
        {
          "field": "Exchange",
          "value": "Nasdaq"
        },
        {
          "field": "Sector",
          "value": "Technology"
        },
        {
          "field": "Industry",
          "value": "Semiconductors"
        },
        {
          "field": "Country",
          "value": "United States"
        },
        {
          "field": "Currency",
          "value": "USD"
        }
      ]
    },
    {
      "section_title": "Market statistics",
      "items": [
        {
          "field": "Market cap",
          "value": "$5.26T"
        },
        {
          "field": "Trailing P/E",
          "value": "30.74"
        },
        {
          "field": "52-week high",
          "value": "$237.07"
        },
        {
          "field": "52-week low",
          "value": "$118.00"
        },
        {
          "field": "Dividend yield",
          "value": "0.08%"
        },
        {
          "field": "Shares outstanding",
          "value": "24.5B"
        }
      ]
    }
  ]
}Income Statement Highlights · Annual financials
| METRIC | PERIOD | VALUE |
|---|---|---|
| Revenue | TTM | $302.97B |
| Revenue per Share | TTM | $12.48 |
| Quarterly Revenue Growth | YoY | 105.90% |
| Gross Profit | TTM | $226.24B |
| EBITDA | TTM | $201.27B |
| Net Income | TTM | $192.88B |
| Diluted EPS | TTM | $7.91 |
| Quarterly Earnings Growth | YoY | 125.90% |
{
  "table": {
    "columns": [
      {
        "key": "metric",
        "label": "METRIC"
      },
      {
        "key": "period",
        "label": "PERIOD"
      },
      {
        "key": "value",
        "label": "VALUE"
      }
    ],
    "rows": [
      {
        "metric": "Revenue",
        "period": "TTM",
        "value": "$302.97B"
      },
      {
        "metric": "Revenue per Share",
        "period": "TTM",
        "value": "$12.48"
      },
      {
        "metric": "Quarterly Revenue Growth",
        "period": "YoY",
        "value": "105.90%"
      },
      {
        "metric": "Gross Profit",
        "period": "TTM",
        "value": "$226.24B"
      },
      {
        "metric": "EBITDA",
        "period": "TTM",
        "value": "$201.27B"
      },
      {
        "metric": "Net Income",
        "period": "TTM",
        "value": "$192.88B"
      },
      {
        "metric": "Diluted EPS",
        "period": "TTM",
        "value": "$7.91"
      },
      {
        "metric": "Quarterly Earnings Growth",
        "period": "YoY",
        "value": "125.90%"
      }
    ]
  }
}Earnings estimates, EPS results and analyst rating actions
| DATE | FIRM | ACTION | PREVIOUS RATING | NEW RATING | TARGET |
|---|---|---|---|---|---|
| Sep 24, 2026 | Firm A | Upgrade | Hold | Buy | $250 |
| Sep 11, 2026 | Firm B | Reiterate | Buy | Buy | $240 |
| Aug 28, 2026 | Firm C | Downgrade | Buy | Hold | $215 |
| Aug 13, 2026 | Firm D | Raise target | Buy | Buy | $235 |
{
  "chart": {
    "title": "Earnings estimates vs reported EPS",
    "labels": [
      "Q4 2024",
      "Q1 2025",
      "Q2 2025",
      "Q3 2025",
      "Q4 2025",
      "Q1 2026",
      "Q2 2026"
    ],
    "series": {
      "actual_eps": [
        0.89,
        0.81,
        1.05,
        1.3,
        1.62,
        1.87,
        2.22
      ],
      "estimate_eps": [
        0.85,
        0.75,
        1.01,
        1.26,
        1.54,
        1.77,
        2.09
      ]
    }
  },
  "table": {
    "title": "Recent analyst rating actions",
    "columns": [
      {
        "key": "date",
        "label": "DATE"
      },
      {
        "key": "firm",
        "label": "FIRM"
      },
      {
        "key": "action",
        "label": "ACTION"
      },
      {
        "key": "previous_rating",
        "label": "PREVIOUS RATING"
      },
      {
        "key": "new_rating",
        "label": "NEW RATING"
      },
      {
        "key": "target",
        "label": "TARGET"
      }
    ],
    "rows": [
      {
        "date": "Sep 24, 2026",
        "firm": "Firm A",
        "action": "Upgrade",
        "previous_rating": "Hold",
        "new_rating": "Buy",
        "target": "$250"
      },
      {
        "date": "Sep 11, 2026",
        "firm": "Firm B",
        "action": "Reiterate",
        "previous_rating": "Buy",
        "new_rating": "Buy",
        "target": "$240"
      },
      {
        "date": "Aug 28, 2026",
        "firm": "Firm C",
        "action": "Downgrade",
        "previous_rating": "Buy",
        "new_rating": "Hold",
        "target": "$215"
      },
      {
        "date": "Aug 13, 2026",
        "firm": "Firm D",
        "action": "Raise target",
        "previous_rating": "Buy",
        "new_rating": "Buy",
        "target": "$235"
      }
    ]
  }
}News and press releases associated with a ticker
PRESS RELEASE
Business Wire · Related ticker: NVDA
PRESS RELEASE
Business Wire · Related ticker: NVDA
PRESS RELEASE
Business Wire · Related ticker: NVDA
PRESS RELEASE
Business Wire · Related ticker: NVDA
PRESS RELEASE
Business Wire · Related ticker: NVDA
{
  "articles": [
    {
      "tag": "PRESS RELEASE",
      "date": "Sep 30, 2026",
      "title": "Lenovo AI Express with NVIDIA Accelerates Path to Hybrid AI Factory in Weeks",
      "publisher": "Business Wire",
      "ticker": "NVDA",
      "url": "#"
    },
    {
      "tag": "PRESS RELEASE",
      "date": "Sep 30, 2026",
      "title": "CoreWeave Delivers NVIDIA Vera Rubin NVL72 Performance at Production Scale, Starting With Cognition",
      "publisher": "Business Wire",
      "ticker": "NVDA",
      "url": "#"
    },
    {
      "tag": "PRESS RELEASE",
      "date": "Sep 30, 2026",
      "title": "Ennoble Care Selects CoreWeave to Power AI Inference Across Its Home-Based Care Network",
      "publisher": "Business Wire",
      "ticker": "NVDA",
      "url": "#"
    },
    {
      "tag": "PRESS RELEASE",
      "date": "Sep 30, 2026",
      "title": "CoreWeave to Offer NVIDIA Vera, the First CPU Built for AI Agents",
      "publisher": "Business Wire",
      "ticker": "NVDA",
      "url": "#"
    },
    {
      "tag": "PRESS RELEASE",
      "date": "Sep 30, 2026",
      "title": "CScale Exits Stealth With $145 Million to Build the Interconnect for Gigawatt-Scale AI",
      "publisher": "Business Wire",
      "ticker": "NVDA",
      "url": "#"
    }
  ]
}Portfolio composition · Reporting snapshot
| TICKER | HOLDING NAME | PORTFOLIO WEIGHT | AS OF |
|---|---|---|---|
| NVDA | NVIDIA Corporation | 8.33% | Sample record |
| AAPL | Apple Inc. | 7.88% | Sample record |
| MSFT | Microsoft Corporation | 7.35% | Sample record |
| AMZN | Amazon.com, Inc. | 5.53% | Sample record |
| META | Meta Platforms, Inc. | 3.71% | Sample record |
| GOOGL | Alphabet Inc. (Class A) | 3.35% | Sample record |
| GOOG | Alphabet Inc. (Class C) | 3.12% | Sample record |
{
  "table": {
    "columns": [
      {
        "key": "ticker",
        "label": "TICKER"
      },
      {
        "key": "holding_name",
        "label": "HOLDING NAME"
      },
      {
        "key": "portfolio_weight",
        "label": "PORTFOLIO WEIGHT"
      },
      {
        "key": "as_of",
        "label": "AS OF"
      }
    ],
    "rows": [
      {
        "ticker": "NVDA",
        "holding_name": "NVIDIA Corporation",
        "portfolio_weight": "8.33%",
        "as_of": "Sample record"
      },
      {
        "ticker": "AAPL",
        "holding_name": "Apple Inc.",
        "portfolio_weight": "7.88%",
        "as_of": "Sample record"
      },
      {
        "ticker": "MSFT",
        "holding_name": "Microsoft Corporation",
        "portfolio_weight": "7.35%",
        "as_of": "Sample record"
      },
      {
        "ticker": "AMZN",
        "holding_name": "Amazon.com, Inc.",
        "portfolio_weight": "5.53%",
        "as_of": "Sample record"
      },
      {
        "ticker": "META",
        "holding_name": "Meta Platforms, Inc.",
        "portfolio_weight": "3.71%",
        "as_of": "Sample record"
      },
      {
        "ticker": "GOOGL",
        "holding_name": "Alphabet Inc. (Class A)",
        "portfolio_weight": "3.35%",
        "as_of": "Sample record"
      },
      {
        "ticker": "GOOG",
        "holding_name": "Alphabet Inc. (Class C)",
        "portfolio_weight": "3.12%",
        "as_of": "Sample record"
      }
    ]
  },
  "footer_badges": [
    {
      "label": "Top holdings",
      "description": "Ranked by portfolio weight"
    },
    {
      "label": "Full holdings",
      "description": "Where a complete list is available"
    },
    {
      "label": "History",
      "description": "Reported snapshots by date"
    }
  ]
}Transaction-level activity reported in regulatory disclosures
| REPORTED DATE | REPORTING PERSON | POSITION | TRANSACTION | SHARES | VALUE |
|---|---|---|---|---|---|
| Oct 19, 2026 | Tim Cook | Chief Executive Officer | Sale | 50,000 | $11.52M |
| Oct 09, 2026 | Luca Maestri | Chief Financial Officer | Sale | 25,000 | $5.76M |
| Sep 28, 2026 | Katherine Adams | General Counsel | Sale | 15,000 | $3.46M |
| Sep 12, 2026 | Deirdre O’Brien | Senior Vice President | Sale | 12,000 | $2.76M |
| Aug 27, 2026 | Arthur D. Levinson | Chairman of the Board | Sale | 20,000 | $4.61M |
| Aug 15, 2026 | Chris Kondo | Principal Accounting Officer | Sale | 5,500 | $1.27M |
| Jul 22, 2026 | Jeff Williams | Chief Operating Officer | Sale | 18,000 | $4.15M |
{
  "table": {
    "columns": [
      {
        "key": "reported_date",
        "label": "REPORTED DATE"
      },
      {
        "key": "reporting_person",
        "label": "REPORTING PERSON"
      },
      {
        "key": "position",
        "label": "POSITION"
      },
      {
        "key": "transaction",
        "label": "TRANSACTION"
      },
      {
        "key": "shares",
        "label": "SHARES"
      },
      {
        "key": "value",
        "label": "VALUE"
      }
    ],
    "rows": [
      {
        "reported_date": "Oct 19, 2026",
        "reporting_person": "Tim Cook",
        "position": "Chief Executive Officer",
        "transaction": "Sale",
        "shares": "50,000",
        "value": "$11.52M"
      },
      {
        "reported_date": "Oct 09, 2026",
        "reporting_person": "Luca Maestri",
        "position": "Chief Financial Officer",
        "transaction": "Sale",
        "shares": "25,000",
        "value": "$5.76M"
      },
      {
        "reported_date": "Sep 28, 2026",
        "reporting_person": "Katherine Adams",
        "position": "General Counsel",
        "transaction": "Sale",
        "shares": "15,000",
        "value": "$3.46M"
      },
      {
        "reported_date": "Sep 12, 2026",
        "reporting_person": "Deirdre O'Brien",
        "position": "Senior Vice President",
        "transaction": "Sale",
        "shares": "12,000",
        "value": "$2.76M"
      },
      {
        "reported_date": "Aug 27, 2026",
        "reporting_person": "Arthur D. Levinson",
        "position": "Chairman of the Board",
        "transaction": "Sale",
        "shares": "20,000",
        "value": "$4.61M"
      },
      {
        "reported_date": "Aug 15, 2026",
        "reporting_person": "Chris Kondo",
        "position": "Principal Accounting Officer",
        "transaction": "Sale",
        "shares": "5,500",
        "value": "$1.27M"
      },
      {
        "reported_date": "Jul 22, 2026",
        "reporting_person": "Jeff Williams",
        "position": "Chief Operating Officer",
        "transaction": "Sale",
        "shares": "18,000",
        "value": "$4.15M"
      }
    ]
  }
}Regulatory disclosure history · Form and document metadata
| FILED | FORM | DESCRIPTION | ACCESSION NUMBER | DOCUMENT |
|---|---|---|---|---|
| Jul 31, 2026 | 10-Q | Quarterly report | 0001045810-26-000088 | View filing ↗ |
| Jul 30, 2026 | 8-K | Current report | 0001045810-26-000085 | View filing ↗ |
| May 29, 2026 | 10-Q | Quarterly report | 0001045810-26-000062 | View filing ↗ |
| May 22, 2026 | 8-K | Current report | 0001045810-26-000058 | View filing ↗ |
| Feb 26, 2026 | 10-K | Annual report | 0001045810-26-000021 | View filing ↗ |
| Nov 20, 2025 | 10-Q | Quarterly report | 0001045810-25-000112 | View filing ↗ |
{
  "table": {
    "columns": [
      {
        "key": "filed_date",
        "label": "FILED"
      },
      {
        "key": "form",
        "label": "FORM"
      },
      {
        "key": "description",
        "label": "DESCRIPTION"
      },
      {
        "key": "accession_number",
        "label": "ACCESSION NUMBER"
      },
      {
        "key": "document",
        "label": "DOCUMENT"
      }
    ],
    "rows": [
      {
        "filed_date": "Jul 31, 2026",
        "form": "10-Q",
        "description": "Quarterly report",
        "accession_number": "0001045810-26-000088",
        "document": "View filing ↗"
      },
      {
        "filed_date": "Jul 30, 2026",
        "form": "8-K",
        "description": "Current report",
        "accession_number": "0001045810-26-000085",
        "document": "View filing ↗"
      },
      {
        "filed_date": "May 29, 2026",
        "form": "10-Q",
        "description": "Quarterly report",
        "accession_number": "0001045810-26-000062",
        "document": "View filing ↗"
      },
      {
        "filed_date": "May 22, 2026",
        "form": "8-K",
        "description": "Current report",
        "accession_number": "0001045810-26-000058",
        "document": "View filing ↗"
      },
      {
        "filed_date": "Feb 26, 2026",
        "form": "10-K",
        "description": "Annual report",
        "accession_number": "0001045810-26-000021",
        "document": "View filing ↗"
      },
      {
        "filed_date": "Nov 20, 2025",
        "form": "10-Q",
        "description": "Quarterly report",
        "accession_number": "0001045810-25-000112",
        "document": "View filing ↗"
      }
    ]
  }
}Use FinImpulse MCP for AI research, REST API for financial applications, and integrations for automated monitoring and reporting.
Compare companies, review earnings, and investigate insider activity using structured financial data in your AI client.
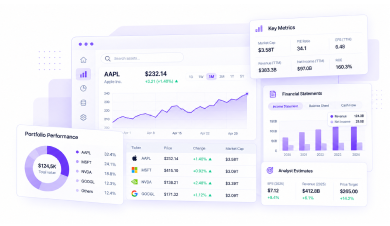
Build market dashboards, portfolio tools, and analytics features with historical prices, company financials, and financial metrics.
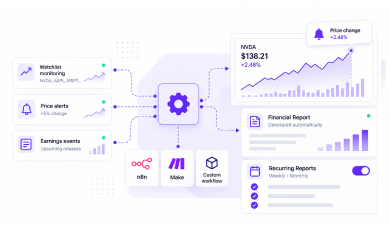
Track watchlists, monitor market changes, and generate recurring financial reports using n8n, Make, or custom workflows.
Explore market coverage, available instruments, and historical depth across global market prices, financial statements, ETF holdings, and forex, including real-time US equity data.
Market-level stock, ETF, mutual fund, and index coverage, including historical daily OHLCV data.
| Market | Stocks | ETFs | Mutual funds | Indices | History from* |
|---|---|---|---|---|---|
| United States | 21.3K | 6.3K | 166.4K | 23.4K | 1970 |
| Canada | 6.1K | 3.8K | 31.6K | 84 | 1980 |
| United Kingdom | 8.1K | 8.9K | 26.5K | 1.8K | 1970 |
| Europe (ex-UK) | 213.5K | 40.3K | 106.3K | 11.7K | 1985 |
| Asia-Pacific | 85.2K | 5.0K | 29.0K | 2.5K | 1983 |
| Other markets | 10.3K | 1.8K | 9.6K | 1.1K | 1998 |
US Real-Time Market Data: 15 exchanges · 30 ATSs · Trades · Quotes · OHLCV · Market Depth
* Earliest observed stock daily OHLCV by region. Figures are rounded market-level listings, not unique worldwide securities
Availability of annual, quarterly, and trailing company financial statements across global markets.
| Market* | Annual Income | Balance Sheet | Cash Flow | Quarterly Income | TTM Income |
|---|---|---|---|---|---|
| United States | 9.0K | 9.0K | 9.0K | 8.0K | 9.4K |
| Canada | 2.8K | 2.8K | 2.8K | 2.7K | 2.8K |
| United Kingdom | 4.0K | 4.0K | 4.0K | 1.6K | 4.1K |
| Europe (ex-UK) | 23.2K | 23.2K | 23.2K | 13.2K | 27.4K |
| Asia-Pacific | 28.6K | 28.6K | 28.6K | 24.5K | 29.5K |
| Other markets | 3.0K | 3.0K | 3.0K | 2.3K | 3.1K |
Financial statement types: Income Statement · Balance Sheet · Cash Flow · Annual / Quarterly / TTM
* Counts are listings with available data for each statement type. One issuer may appear on multiple markets
Top holdings and complete historical portfolio snapshots, with availability and reporting dates varying by ETF
| Dataset | Coverage | History / availability | Data returned |
|---|---|---|---|
| Top 10 ETF holdings | ETFs with disclosed data | Latest available report | Top 10 positions and weights |
| Full holdings snapshots | ~10,000 ETFs | From January 2026 | Full portfolio, shares, weights and value |
| Extended ETF history | ~500 ETFs | Selected 2023-2025 records | Full portfolio composition by date |
| Available reporting dates | ETFs with historical data | Individual dates per ETF | Snapshot dates for historical queries |
Update cadence: Varies by ETF, from several times a week to once a month
* Historical holdings coverage is approximate; availability and reporting dates depend on each ETF.
Currency-pair coverage by quote currency, with historical records dating back to 1996 for selected pairs.
| Quote currency | Currency pairs* | History from** | Example pair |
|---|---|---|---|
| USD quote | 149 | 1996 | EUR/USD |
| EUR quote | 63 | 2003 | AUD/EUR |
| GBP quote | 83 | 1999 | CAD/GBP |
| JPY quote | 48 | 1996 | USD/JPY |
| CHF quote | 41 | 2003 | GBP/CHF |
| Other quote currencies | 1.2K | 1998 | EUR/SEK |
Total distinct pairs: 1,552 currency pairs · Historical records available through October 2026
* Counts represent distinct ordered currency pairs (base/quote), rather than interchangeable currency combinations.
** Earliest observed record per group; historical length and recent data availability vary by currency pair.
Compare four plans by dataset availability, monthly request limits, and additional usage rates.
Core financial data with 5 years of historical prices
10,000 requests /month
Extra usage $2.40 /1,000 requests
Choose BasicExtended historical data, financials, intraday prices, and fund holdings
100,000 requests /month
Extra usage $1.80 /1,000 requests
Choose StartupFull API dataset access, including analyst, insider, SEC data
1,000,000 requests /month
Extra usage $0.99 /1,000 requests
Choose ProfessionalFull dataset access with higher request limits and lower usage rates
3,000,000 requests /month
Extra usage $0.80 /1,000 requests
Choose EnterpriseGet 500 API requests every month, available immediately after signup. No credit card or billing details required.
Create a FinImpulse account, get your API key, and follow the setup instructions for your preferred MCP-compatible client.
FinImpulse works with MCP-compatible AI assistants and development environments, including Claude Desktop, Claude Code, ChatGPT, Cursor, Gemini CLI, and VS Code.
MCP lets AI agents access financial data within supported clients. REST API provides direct access for applications, dashboards, and automated workflows.
Yes, subject to applicable data licensing terms. Public display and redistribution may require additional exchange permissions. Raw data resale and competing API services are excluded.
Visit the FinImpulse documentation for MCP setup guides, REST API endpoints, request examples, and dataset details.
Yes. Every new account starts with 500 free requests per month. No credit card required. Available datasets depend on your plan.
 United States
 Canada
 United Kingdom
 Europe (ex-UK)
 Asia-Pacific