
Financial Statements API

REST API · For developers

Build Company Financials Using Financial Statements API

Retrieve structured financial statements and historical valuation metrics through dedicated APIs. Financial Statements API provides multi-period Income Statements, Balance Sheets, Cash Flow Statements, and historical valuation measures including P/E, P/S, P/B, EV/EBITDA, and other commonly used valuation ratios.

Use it to build financial analysis platforms, valuation tools, AI assistants, research applications, and business intelligence systems that require structured historical financial data without collecting filings from multiple sources.

Includes 4 Financial APIs View Documentation
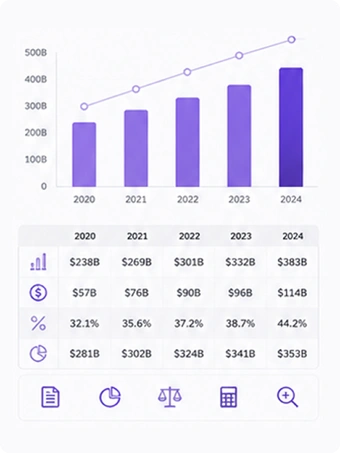
Bar and line chart showing values rising from $238B in 2020 to $383B in 2024, with a connected line trending upward alongside it. Below, a table breaks down four metrics by year (2020-2024) with icons for a bar chart, dollar sign, percentage, and pie chart, followed by a row of five action icons: document, pie chart, scale, calculator, and magnifying glass.

Financial Statements APIs


Description

Retrieve complete company financial statements through three dedicated APIs: Income Statement, Balance Sheet, and Cash Flow Statement. Access structured historical financial data for revenue, profitability, assets, liabilities, equity, and cash flow across multiple reporting periods.

Build financial analysis platforms, company research pages, AI workflows, financial dashboards, and business intelligence applications using standardized financial statements instead of parsing company filings.


Interface Example
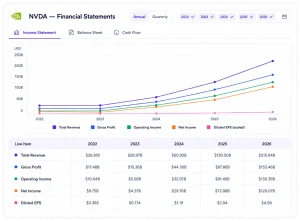
Company Financial Statements interface example for NVDA, with an Annual/Quarterly toggle (Annual active), year filters 2022-2026, and tabs for Income Statement, Balance Sheet, and Cash Flow (Income Statement active). A multi-line chart shows five metrics — Total Revenue, Gross Profit, Operating Income, Net Income, and Diluted EPS — trending upward from 2022 to 2026, followed by a data table listing the same five line items with values for each year.

Output Example

Fiscal Year End

2022-01-31

2023-01-31

2024-01-31

2025-01-31

2026-01-31

Income Statement

Total Revenue

$26.91B

$26.97B

$60.92B

$130.50B

$215.94B

Gross Profit

$17.48B

$15.36B

$44.30B

$97.86B

$153.46B

Operating Income

$10.04B

$5.58B

$32.97B

$81.45B

$130.39B

Net Income

$9.75B

$4.37B

$29.76B

$72.88B

$120.07B

Diluted EPS

$0.385

$0.174

$1.19

$2.94

$4.90

Balance Sheet

Total Assets

$44.19B

$41.18B

$65.73B

$111.60B

$206.80B

Total Liabilities

$17.58B

$19.08B

$22.75B

$32.27B

$49.51B

Stockholders’ Equity

$26.61B

$22.10B

$42.98B

$79.33B

$157.29B

Cash Flow Statement

Operating Cash Flow

$9.11B

$5.64B

$28.09B

$64.09B

$102.72B

Capital Expenditure

−$0.98B

−$1.83B

−$1.07B

−$3.24B

−$6.04B

Free Cash Flow

$8.13B

$3.81B

$27.02B

$60.85B

$96.68B


How to Build this Workflow

This workflow is built using the following FinImpulse APIs

Resources


API Cost Examples

Scenario APIs Used Usage Example Estimated Monthly Cost
Annual Financial Statements Income Statement API, Balance Sheet API, Cash Flow API 1,000 companies × 5 years of annual reports ≈ $17.40
Income Statement API (Calls) = $0.00080 + Balance Sheet API (Calls) = $0.00080 + Cash Flow API (Calls) = $0.00080
Total = $0.00240
1,000 companies × $0.0024 = $2.40
Income Statement API (Rows) = $0.00100 + Balance Sheet API (Rows) = $0.00100 + Cash Flow API (Rows) = $0.00100
Total = $0.00300
1,000 companies × 5 years of annual reports = 5,000 reports
5,000 reports × $0.00300 = $15.00
Grand Total = $2.40 + $15.00 = $17.40 / month
Historical Prices (5Y) Income Statement API, Balance Sheet API, Cash Flow API 1,000 companies × 1 year of quarterly reports ≈ $14.40
Income Statement API (Calls) = $0.00080 + Balance Sheet API (Calls) = $0.00080 + Cash Flow API (Calls) = $0.00080
Total = $0.00240
1,000 companies × $0.0024 = $2.40
Income Statement API (Rows) = $0.00100 + Balance Sheet API (Rows) = $0.00100 + Cash Flow API (Rows) = $0.00100
Total = $0.00300
1,000 companies × 4 quarters (1 year of quarterly reports) = 4,000 reports
4,000 reports × $0.00300 = $12.00
Grand Total = $2.40 + $12.00 = $14.40 / month

Disclaimer. The pricing examples above are calculated using the APIs shown in this workflow and represent typical usage scenarios. Static data can be cached client-side to reduce actual costs below these estimates, and the Sandbox environment is available for development and testing separately from production usage. Actual costs depend on the endpoints, datasets, response size, request frequency, caching strategy, and additional data included in your application.

FinImpulse provides financial data and analytics APIs only. AI-generated responses depend on the application, prompts, and language model used. FinImpulse does not provide investment advice, trading recommendations, or guarantee the accuracy of AI-generated conclusions.

Valuation History API


Description

Retrieve historical valuation ratios including P/E, P/S, P/B, EV/EBITDA, EV/Revenue, PEG, and other commonly used valuation metrics through a lightweight API. Analyze how company valuation changes over time without downloading complete financial statements.

Use Valuation History API to build valuation charts, screening tools, market comparison dashboards, AI assistants, and research applications that need historical multiples for thousands of companies.


Interface Example
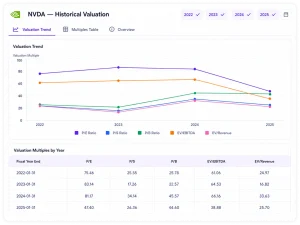
NVDA Historical Valuation interface example with year filters (2022-2025) and tabs for Valuation Trend, Multiples Table, and Overview (Valuation Trend active). A multi-line chart shows five valuation metrics — P/E Ratio, P/S Ratio, P/B Ratio, EV/EBITDA, and EV/Revenue — plotted from 2022 to 2025, followed by a

Output Example

Fiscal Year End

P/E Ratio

P/S Ratio

P/B Ratio

EV/EBITDA

EV/Revenue

2022-01-31

75.46

25.55

25.78

61.06

24.97

2023-01-31

83.14

17.26

22.57

64.53

16.82

2024-01-31

81.17

34.14

45.57

66.16

33.63

2025-01-31

47.40

26.36

44.60

38.88

25.70


How to Build this Workflow

This workflow is built using the following FinImpulse APIs

Resources


API Cost Examples

Scenario APIs Used Usage Example Estimated Monthly Cost
Historical Valuation Ratios Valuation History API 1,000 companies × 5 years of annual valuation history ≈ $1.05
Valuation History API (Calls) = $0.00080
1,000 companies × $0.00080 = $0.80
Valuation History API (Rows) = $0.00005
1,000 companies × 5 years of annual history = 5,000 reports
5,000 reports × $0.00005 = $0.25
Total = $0.80 + $0.25 = $1.05 / month
Historical Valuation Ratios Valuation History API 100,000 companies × 5 years of annual valuation history ≈ $105.00
Valuation History API (Calls) = $0.00080
100,000 companies × $0.00080 = $80.00
Valuation History API (Rows) = $0.00005
100,000 companies × 5 years of annual history = 500,000 reports
500,000 reports × $0.00005 = $25.00
Total = $80.00 + $25.00 = $105.00 / month

Disclaimer. The pricing examples above are calculated using the APIs shown in this workflow and represent typical usage scenarios. Static data can be cached client-side to reduce actual costs below these estimates, and the Sandbox environment is available for development and testing separately from production usage. Actual costs depend on the endpoints, datasets, response size, request frequency, caching strategy, and additional data included in your application.

FinImpulse provides financial data and analytics APIs only. AI-generated responses depend on the application, prompts, and language model used. FinImpulse does not provide investment advice, trading recommendations, or guarantee the accuracy of AI-generated conclusions.

Start building with FinImpulse API