

Metrics & Dividends API
Description
Retrieve pre-calculated dividend, return, profitability, risk, and growth metrics through a single API request. Metrics & Dividends API returns forward and trailing annual dividend rate and yield, 1-year and 3-year returns, 50-day and 200-day price change, Free Cash Flow Margin, Return on Invested Capital (ROIC), Net Margin, Return on Equity (ROE), Beta, Debt-to-Equity, Revenue Stability, Revenue Growth, and EPS Growth in a single response.
Use it to build dividend-focused screening tools and yield-based stock screeners, quality and factor screening platforms based on profitability and revenue stability, growth-at-a-reasonable-price (GARP) screeners, risk profiling and volatility dashboards, automated portfolio monitoring tools, asset comparison tables, and AI-driven company research assistants. The endpoint is optimized for applications that need ready-to-use financial indicators, without requiring the manual combination of historical price and financial statement datasets.
The Metrics & Dividends API is primarily designed for stocks. For ETFs and mutual funds, some fundamental and profitability fields may not apply and can return null.
Interface Example
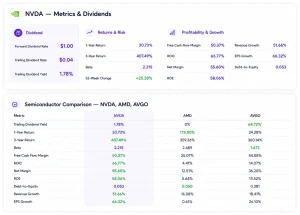
Output Example
|
Metric |
Value |
|---|---|
|
Forward Dividend Rate |
$1.00 |
|
Forward Dividend Yield |
47% |
|
Trailing Dividend Rate |
$0.04 |
|
Trailing Dividend Yield |
1.89% |
|
1-Year Return |
24.49% |
|
3-Year Return |
367.35% |
|
50-Day Avg. Change |
+1.38% |
|
200-Day Avg. Change |
+10.59% |
|
52-Week Change |
+24.00% |
|
Free Cash Flow Margin |
50.37% |
|
Return on Invested Capital (ROIC) |
66.77% |
|
Net Margin |
55.60% |
|
Return on Equity (ROE) |
58.06% |
|
Beta |
2.211 |
|
Debt-to-Equity |
0.053 |
|
Revenue Stability |
87.85% |
|
Revenue Growth |
51.66% |
|
EPS Growth |
66.32% |
How to Build this Workflow
This workflow is built using the following FinImpulse APIs
- Metrics & Dividends API
- Search Lite API (optional)
- Company Profile API (optional)
- Historical Price Data API (optional)
Resources
Disclaimer. FinImpulse provides financial data and analytics APIs only. AI-generated responses depend on the application, prompts, and language model used. FinImpulse does not provide investment advice, trading recommendations, or guarantee the accuracy of AI-generated conclusions.