Congressional Trades: U.S. Federal Disclosure Data in FinImpulse Dashboard
A breakdown of the Congressional Trades section in FinImpulse — disclosure data, filing structure, and six views for exploring it.

Congressional securities disclosures are among the most discussed public datasets in financial markets. They provide visibility into which assets appear in filings submitted by members of Congress and their families.
FinImpulse now aggregates this data in a dedicated Congressional Trades section available directly in the dashboard.
What Congressional Disclosure Data Is
In 2012, the United States enacted the Stop Trading on Congressional Knowledge Act, which requires senators and representatives to report personal securities transactions within 45 days of execution. The disclosures cover transactions made by the member, their spouse, and dependent children, and must include the asset name, transaction type, approximate value, and transaction date. The data reflects official filings as submitted — not verified or audited market activity.
The filings also carry several structural limitations:
- Transaction amounts are reported within predefined ranges ($1K-$15K, $15K-$50K, $100K-$250K, and so on) rather than as exact figures.
- The gap between a transaction date and its report date, referred to as the filing delay, can range from a few days to well beyond the statutory 45-day deadline.
These constraints are part of the public record as filed.
FinImpulse now includes a dedicated section for these disclosures — Congressional Trades. With it, users can explore disclosure activity from multiple perspectives — individual transactions, politicians, tickers, sectors, party breakdowns, and historical performance of disclosed assets.
The Congressional Trades Section in the FinImpulse Dashboard
The new section aggregates U.S. federal securities disclosures into a structured, filterable view — covering individual transactions, aggregated ticker activity, politician-level data, asset performance, and party-level breakdowns.
The data is organized across six tabs:
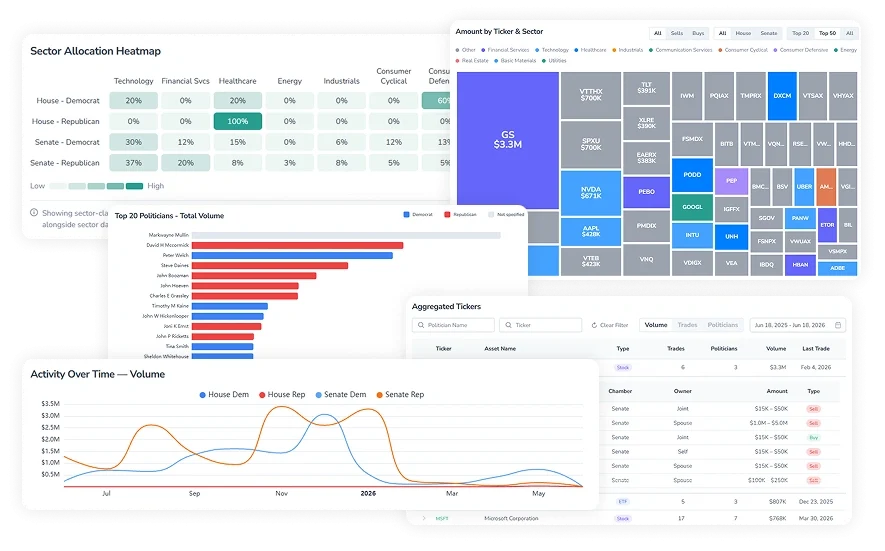
Overview
The Overview tab provides an aggregate view of congressional trading activity for the selected period. It covers total trade count, buy/sell-side volume, sector allocation by party and chamber, ETF and fund allocation, disclosed volume across the full ticker universe, and a ranking of the most active politicians by total disclosed volume.
Trades
The Trades tab provides a transaction-level view of congressional filings. Each record covers the asset, politician, transaction type, amount range, and filing delay. The tab also includes the largest disclosed trades for the selected period, a breakdown of how promptly filings were submitted relative to transaction dates, and a distribution of transactions by owner — whether filed under the member’s own name, a spouse, a joint account, or a dependent child.
Tickers
The Tickers tab organizes disclosure data by asset rather than by individual transaction. It includes a volume treemap identical in structure to the one in Overview, along with a table showing each asset’s total trade count, number of politicians involved, disclosed volume, and the date of the last transaction. Each row in the table can be expanded to reveal the individual filings behind that ticker — including the politician, party, chamber, owner, amount range, and transaction type.
Politicians
The Politicians tab presents disclosure data organized by individual members of Congress. It includes an activity chart showing transaction trends over time, broken down by party and chamber, a table of all politicians with their total trade count, disclosed volume, number of distinct tickers, and date of last transaction, and a ranking of the most active politicians by total trades and volume.
Performance
The Performance tab shows the 1-year price performance of the top 100 tickers by congressional disclosure volume, ranked from highest to lowest and broken down by asset type — stocks, ETFs, and mutual funds.
This makes it possible to compare disclosure activity with subsequent market performance and identify which disclosed assets delivered the strongest returns over the selected period.
Party Breakdown
The Party Breakdown tab consolidates congressional disclosure activity across all four legislative groups. It covers aggregate figures for the selected period, sector allocation by party and chamber, disclosed volume by asset, trading activity over time, and a sector-level ranking showing which sectors, parties, and chambers account for the most activity.
All tabs support date range filtering — with preset options or a custom range — and most include additional controls for transaction type, chamber, and politician count.
Working With the Congressional Disclosure Data
Congressional disclosure data is publicly available, but reviewing individual filings one by one is time-consuming. The Congressional Trades section in FinImpulse organizes those filings into searchable views by transaction, ticker, politician, sector, and party, making it easier to explore the data and understand how disclosure activity evolves over time.