Tarification API transparente pour des produits financiers évolutifs

Ne payez que pour vos requêtes et le volume de données renvoyées sur les actions, ETF, fonds communs de placement, états financiers, jeux de données d’analystes, positions détenues et marchés des options.

Comment fonctionne la tarification de l’API FinImpulse

Une tarification à l’usage conçue pour une infrastructure financière évolutive, des workflows d’automatisation et des déploiements en production.

Tarification Appel + Ligne

La tarification repose sur les requêtes API et la taille des jeux de données renvoyés.

Accès par endpoint

N'utilisez que les jeux de données et catégories d'infrastructure dont votre produit a besoin.


Tests en sandbox

Testez vos intégrations avec des tokens sandbox, des réponses en cache et des environnements isolés.

Crédit développeur

Commencez à tester l'infrastructure avec le crédit API inclus et des jeux de données en direct.


Mise à l'échelle prête pour la production

Passez des prototypes aux systèmes de production sans modifier les couches d'infrastructure.

Gestion sécurisée des tokens

Gérez vos tokens API live, sandbox et personnalisés avec une liste blanche IP en option.

Tarification de l’API pour les jeux de données financières

Une tarification structurée pour les actions, ETF et fonds communs de placement, couvrant les données de marché, les états financiers, les données analytiques, les positions détenues et les données sur les options.

DataDescriptionEndpoint(s)Price
Analyst CoverageAnalyst-level coverage records with ratings, sentiment, targets, and scores/analysis/analystsCall $0.0008 + Row $0.00015
Earnings & EstimatesEarnings estimates, EPS history, revenue data, revisions, and growth metrics/analysis/earningsCall $0.0008 + Row $0.00015
Analyst RecommendationsHistorical analyst recommendation breakdown across Buy, Hold, and Sell ratings/analysis/recommendationsCall $0.0008 + Row $0.00015
Analyst Rating ActionsAnalyst upgrades, downgrades, reiterations, and price target changes/analysis/upgrades-downgradesCall $0.0008 + Row $0.00015
Filing EventsCompany filing events with filing dates, form types, document metadata, and source URLs/eventsCall $0.00015 + Row $0.00005
Balance SheetMulti-period assets, liabilities, and shareholder equity data/financials/balance_sheetCall $0.0008 + Report $0.001
Cash Flow StatementMulti-period operating, investing, and financing cash flow statements/financials/cash_flowCall $0.0008 + Report $0.001
Income StatementMulti-period revenue, expenses, and earnings statements/financials/income_statementCall $0.0008 + Report $0.001
Valuation HistoryHistorical valuation ratios including P/E, P/S, P/B, and EV/EBITDA/financials/valuation_measuresCall $0.0008 + Report $0.00005
Historical PricesDaily OHLCV price history with adjusted prices and long-term historical coverage/historiesCall $0.0002 + Row $0.00001
Ownership OverviewInstitutional and insider ownership overview with ownership percentages and activity/holders/generalCall $0.0004
Insider RosterCorporate insiders, executives, and officer records/holders/insidersCall $0.0008 + Row $0.0002
Insider TransactionsHistorical insider buying and selling transactions/holders/insiders-transactionsCall $0.0008 + Row $0.0002
Top Institutional HoldersLargest institutional holders with position size and portfolio allocation/holders/institutionalCall $0.0008 + Row $0.0002
Top Mutual Fund HoldersLargest mutual fund holders with position size and allocation data/holders/mutual-fundsCall $0.0008 + Row $0.0002
Market PriceCurrent market price snapshot with change, volume, bid/ask, and market status data/market-priceCall $0.0001
Metrics & DividendsDividend data, returns, profitability, growth, leverage, and business quality metrics/metricsCall $0.0002
NewsStock-related news articles and press releases/newsCall $0.00015 + Row $0.00005
Options ChainOptions chain data with pricing, volume, open interest, and implied volatility/options/chainCall $0.00015 + Row $0.00005
Option Contract DetailsIndividual option contract data with pricing, volume, OI, IV, and underlying price/options/contractsCall $0.0004
Option ExpirationsAvailable option expiration dates for a selected ticker/options/expirationsCall $0.0004
ProfileCompany profile data including description, industry, address, and executives/profileCall $0.0004
SearchGlobal stock search with metadata, pricing snapshots, and profile identifiers/searchCall $0.0004 + Row $0.001
Search LiteLightweight asset search with pricing, market cap, dividend yield, and key market metrics/search-liteCall $0.0001 + Row $0.0001
Annual Return HistoryMulti-year annual return history and performance tracking/statistics/annual-returnsCall $0.0008
Statistics SnapshotMarket statistics, ratios, margins, growth metrics, dividends, and analyst targets/statistics/generalCall $0.0015
Risk SnapshotVolatility, beta, short interest, and market risk indicators/statistics/risksCall $0.0015
SummaryStructured stock snapshot with pricing, valuation, dividends, profitability, and company overview/summaryCall $0.0023
Summary LiteCompany or fund snapshot with profile details, valuation ratios, pricing, and market overview/summary-liteCall $0.0002
DataDescriptionEndpoint(s)Price
Filing EventsCompany filing events with filing dates, form types, document metadata, and source URLs/eventsCall $0.00015 + Row $0.00005
Historical PricesDaily OHLCV price history with adjusted prices and historical coverage/historiesCall $0.0002 + Row $0.00001
Holdings OverviewAggregated holdings overview with allocation breakdowns, exposure data, and valuation metrics/holdings/generalCall $0.0004
All Holdings ListRetrieve the full holdings composition for a selected symbol and historical reporting date./holdings/historyCall $0.00015 + Row $0.000025
Holdings Reporting DatesAvailable historical holdings reporting dates for the selected ETF/holdings/history/datesCall $0.0004
Top 10 HoldingsLargest ETF holdings with weights, allocation percentages, and market values/holdings/top-holdingsCall $0.0004
Market PriceCurrent market price snapshot with change, volume, bid/ask, and market status data/market-priceCall $0.0001
Metrics & DividendsDividend data, returns, profitability, growth, leverage, and business quality metrics/metricsCall $0.0002
NewsETF-related news articles and press releases/newsCall $0.00015 + Row $0.00005
Options ChainOptions chain data with pricing, volume, open interest, and implied volatility/options/chainCall $0.00015 + Row $0.00005
Option Contract DetailsIndividual option contract data with pricing, volume, OI, IV, and underlying price/options/contractsCall $0.0004
Option ExpirationsAvailable option expiration dates for a selected ticker/options/expirationsCall $0.0004
ProfileETF issuer, inception date, legal structure, category, and fund description/profileCall $0.0004
SearchGlobal ETF search with metadata, pricing snapshots, and fund identifiers/searchCall $0.0004 + Row $0.001
Search LiteLightweight asset search with pricing, market cap, dividend yield, and key market metrics/search-liteCall $0.0001 + Row $0.0001
Annual Return HistoryMulti-year ETF return history across calendar periods/statistics/annual-returnsCall $0.0008
Statistics SnapshotFund statistics including flows, volumes, ratios, returns, and category metrics/statistics/generalCall $0.0015
Risk & Factor MetricsVolatility, beta, alpha, Sharpe, Treynor, standard deviation, and factor metrics/statistics/risksCall $0.0015
SummaryETF snapshot with price, NAV, category data, returns, and key fund metrics/summaryCall $0.0023
Summary LiteCompany or fund snapshot with profile details, valuation ratios, pricing, and market overview/summary-liteCall $0.0002
DataDescriptionEndpoint(s)Price
Filing EventsCompany filing events with filing dates, form types, document metadata, and source URLs/eventsCall $0.00015 + Row $0.00005
Historical PricesDaily OHLCV price history with adjusted prices and historical coverage/historiesCall $0.0002 + Row $0.00001
Holdings OverviewAggregated holdings overview with allocation breakdowns, exposure data, and valuation metrics/holdings/generalCall $0.0004
Top 10 HoldingsLargest fund holdings with weights, allocation percentages, and market values/holdings/top-holdingsCall $0.0004
Market PriceCurrent market price snapshot with change, volume, bid/ask, and market status data/market-priceCall $0.0001
Metrics & DividendsDividend data, returns, profitability, growth, leverage, and business quality metrics/metricsCall $0.0002
NewsFund-related news articles and press releases/newsCall $0.00015 + Row $0.00005
ProfileFund description, family, inception date, and legal information/profileCall $0.0004
SearchGlobal fund search with metadata, pricing snapshots, and fund identifiers/searchCall $0.0004 + Row $0.001
Search LiteLightweight asset search with pricing, market cap, dividend yield, and key market metrics/search-liteCall $0.0001 + Row $0.0001
Annual & Trailing Return HistoryMulti-year annual and trailing return history/statistics/annual-returnsCall $0.0008
Statistics SnapshotTrailing returns, category averages, load-adjusted returns, ranks, and up/down year statistics/statistics/generalCall $0.0015
Risk & Factor MetricsAlpha, beta, Sharpe, Treynor, R-squared, standard deviation, and return metrics by horizon/statistics/risksCall $0.0015
SummaryFund snapshot with NAV, price data, category information, and core metrics/summaryCall $0.0023
Summary LiteCompany or fund snapshot with profile details, valuation ratios, pricing, and market overview/summary-liteCall $0.0002

Commencez à tester l'API FinImpulse

Tarification flexible pour les produits en croissance

La tarification évolue en fonction des requêtes API, du volume de données renvoyées et de l’utilisation de l’infrastructure.

La tarification s’adapte à :

  • volume de requêtes
  • taille des jeux de données renvoyés
  • couverture historique
  • fréquence d’actualisation

Convient à :

  • prototypes
  • outils internes
  • systèmes d’automatisation
  • déploiements en production

L’utilisation augmente généralement grâce à :

  • Plus d’actifs Univers plus vastes, listes de suivi, portefeuilles ou couverture plus large
  • Plus de profondeur historique Périodes plus longues et jeux de données élargis
  • Mises à jour plus fréquentes Actualisations planifiées, alertes et workflows d’automatisation

Options de déploiement pour les API financières

Conçu pour l’accès direct aux API, les systèmes d’automatisation, les intégrations IA et les tests en sandbox.


API REST

Pensé pour les intégrations directes, les workflows no-code, les systèmes d'IA et le déploiement évolutif.

n8n

Automatisation de workflows no-code pour le reporting, les systèmes opérationnels et les pipelines produit.

make

Automatisation visuelle pour les systèmes SaaS, les opérations métier et les workflows évolutifs.


MCP Server

Infrastructure financière auto-hébergée pour les systèmes d’IA, les workflows d’agents et les intégrations de modèles.


Remote MCP

Déploiement MCP hébergé pour les intégrations d’IA, sans gestion d’infrastructure requise.


Sandbox et outils de développement

Tokens de sandbox, crédit d’essai, gestion des API et outils de validation pour un déploiement sécurisé.

Accédez aux jeux de données financières en direct

Practical FinImpulse financial data use cases

Real examples of how to turn financial data into dashboards, analytics, automations, and AI-powered tools.

Asset Discovery & Market Snapshots

Snapshots

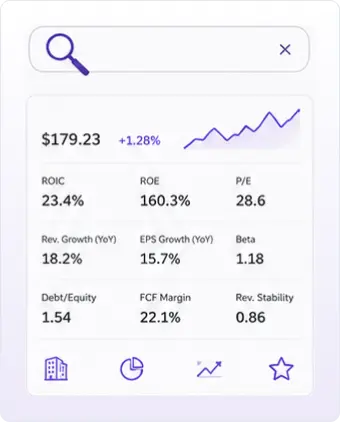
Search stocks, ETFs, and mutual funds with pricing, dividends, valuation, profitability, growth, risk metrics, and exchange metadata in a single request. The endpoint combines market data with pre-calculated financial indicators including ROIC, ROE, Free Cash Flow Margin, Revenue Growth, EPS Growth, Revenue Stability, Beta, and Debt-to-Equity.

Typical use:
  • Asset search & autocomplete
  • Asset overview pages
  • Watchlists & portfolios
  • Stock, ETF & fund screeners
  • Market dashboards
  • Asset comparison tools
  • AI-powered discovery

Financial Statements & Valuation History

valuation history

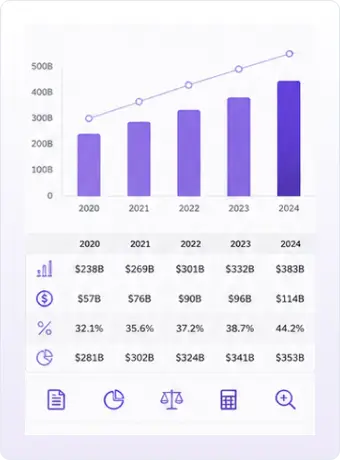
Access structured financial statements, valuation history, and company fundamentals across multiple years of reporting. Retrieve income statements, balance sheets, cash flow statements, financial summaries, and valuation metrics for up to 85,000 assets. Analyze company performance, track financial trends, calculate custom ratios, and build valuation models without processing raw filings.

Typical use:
  • Company fundamentals pages
  • Revenue & earnings trend charts
  • Valuation tracking
  • Financial dashboards
  • Ratio calculations
  • Fundamental screeners
  • AI-powered financial analysis

ETF Holdings & Portfolio Exposure

portfolio exposure

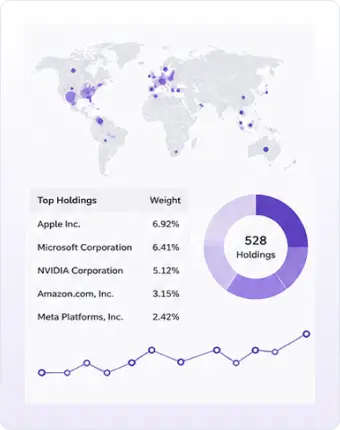
Access allocation breakdowns, exposure metrics, and full holdings data for up to 8,000 ETFs, including historical holdings snapshots collected daily since April 2026. Analyze portfolio concentration, compare funds, monitor allocation changes, and track how holdings evolve over time.

Typical use:
  • ETF profile pages
  • Portfolio exposure analysis
  • Fund comparison tools
  • Holdings tables
  • Concentration analysis
  • Allocation dashboards
  • AI-powered ETF research

Principaux avantages de l’infrastructure FinImpulse

  • Token API sandbox
  • 1 $ de crédit de test
  • Liste blanche IP
  • Prise en charge de MCP
  • Accès à l'API REST
  • Intégrations n8n & Make

Commencez à créer avec l'API FinImpulse