Transparente API-Preise für skalierbare Finanzprodukte

Zahlen Sie nur für Requests und das zurückgegebene Datenvolumen – für Aktien, ETFs, Investmentfonds, Finanzberichte, Analystendaten, Positionen und Optionsmärkte.

So funktionieren die API-Preise von FinImpulse

Usage-basierte Preise, entwickelt für skalierbare Finanzinfrastruktur, Automatisierungsworkflows und Produktivumgebungen.

Call- und Row-basierte Preise

Die Preise richten sich nach API-Requests und der Größe der zurückgegebenen Datensätze.

Zugriff auf Endpoint-Ebene

Nutzen Sie nur die Datensätze und Infrastruktur-Kategorien, die Ihr Produkt benötigt.

Sandbox-Tests

Testen Sie Integrationen mit Sandbox-Tokens, zwischengespeicherten Responses und isolierten Umgebungen.

Developer-Credit

Beginnen Sie mit enthaltenem API-Credit und Live-Datensätzen mit dem Testen der Infrastruktur.

Skalierbar bis Produktionsreife

Skalieren Sie von Prototypen zu Produktionssystemen, ohne Infrastrukturebenen zu wechseln.

Sichere Token-Verwaltung

Verwalten Sie Live-, Sandbox- und benutzerdefinierte API-Tokens mit optionaler IP-Whitelisting.

API-Preise für Finanzdatensätze

Strukturierte Preise für Aktien, ETFs und Investmentfonds über Marktdaten, Finanzdaten, Analytics, Positionen und Optionsdaten.

DataDescriptionEndpoint(s)Price
Analyst CoverageAnalyst-level coverage records with ratings, sentiment, targets, and scores/analysis/analystsCall $0.0008 + Row $0.00015
Earnings & EstimatesEarnings estimates, EPS history, revenue data, revisions, and growth metrics/analysis/earningsCall $0.0008 + Row $0.00015
Analyst RecommendationsHistorical analyst recommendation breakdown across Buy, Hold, and Sell ratings/analysis/recommendationsCall $0.0008 + Row $0.00015
Analyst Rating ActionsAnalyst upgrades, downgrades, reiterations, and price target changes/analysis/upgrades-downgradesCall $0.0008 + Row $0.00015
Filing EventsCompany filing events with filing dates, form types, document metadata, and source URLs/eventsCall $0.00015 + Row $0.00005
Balance SheetMulti-period assets, liabilities, and shareholder equity data/financials/balance_sheetCall $0.0008 + Report $0.001
Cash Flow StatementMulti-period operating, investing, and financing cash flow statements/financials/cash_flowCall $0.0008 + Report $0.001
Income StatementMulti-period revenue, expenses, and earnings statements/financials/income_statementCall $0.0008 + Report $0.001
Valuation HistoryHistorical valuation ratios including P/E, P/S, P/B, and EV/EBITDA/financials/valuation_measuresCall $0.0008 + Report $0.00005
Historical PricesDaily OHLCV price history with adjusted prices and long-term historical coverage/historiesCall $0.0002 + Row $0.00001
Ownership OverviewInstitutional and insider ownership overview with ownership percentages and activity/holders/generalCall $0.0004
Insider RosterCorporate insiders, executives, and officer records/holders/insidersCall $0.0008 + Row $0.0002
Insider TransactionsHistorical insider buying and selling transactions/holders/insiders-transactionsCall $0.0008 + Row $0.0002
Top Institutional HoldersLargest institutional holders with position size and portfolio allocation/holders/institutionalCall $0.0008 + Row $0.0002
Top Mutual Fund HoldersLargest mutual fund holders with position size and allocation data/holders/mutual-fundsCall $0.0008 + Row $0.0002
Market PriceCurrent market price snapshot with change, volume, bid/ask, and market status data/market-priceCall $0.0001
Metrics & DividendsDividend data, returns, profitability, growth, leverage, and business quality metrics/metricsCall $0.0002
NewsStock-related news articles and press releases/newsCall $0.00015 + Row $0.00005
Options ChainOptions chain data with pricing, volume, open interest, and implied volatility/options/chainCall $0.00015 + Row $0.00005
Option Contract DetailsIndividual option contract data with pricing, volume, OI, IV, and underlying price/options/contractsCall $0.0004
Option ExpirationsAvailable option expiration dates for a selected ticker/options/expirationsCall $0.0004
ProfileCompany profile data including description, industry, address, and executives/profileCall $0.0004
SearchGlobal stock search with metadata, pricing snapshots, and profile identifiers/searchCall $0.0004 + Row $0.001
Search LiteLightweight asset search with pricing, market cap, dividend yield, and key market metrics/search-liteCall $0.0001 + Row $0.0001
Annual Return HistoryMulti-year annual return history and performance tracking/statistics/annual-returnsCall $0.0008
Statistics SnapshotMarket statistics, ratios, margins, growth metrics, dividends, and analyst targets/statistics/generalCall $0.0015
Risk SnapshotVolatility, beta, short interest, and market risk indicators/statistics/risksCall $0.0015
SummaryStructured stock snapshot with pricing, valuation, dividends, profitability, and company overview/summaryCall $0.0023
Summary LiteCompany or fund snapshot with profile details, valuation ratios, pricing, and market overview/summary-liteCall $0.0002
DataDescriptionEndpoint(s)Price
Filing EventsCompany filing events with filing dates, form types, document metadata, and source URLs/eventsCall $0.00015 + Row $0.00005
Historical PricesDaily OHLCV price history with adjusted prices and historical coverage/historiesCall $0.0002 + Row $0.00001
Holdings OverviewAggregated holdings overview with allocation breakdowns, exposure data, and valuation metrics/holdings/generalCall $0.0004
All Holdings ListRetrieve the full holdings composition for a selected symbol and historical reporting date./holdings/historyCall $0.00015 + Row $0.000025
Holdings Reporting DatesAvailable historical holdings reporting dates for the selected ETF/holdings/history/datesCall $0.0004
Top 10 HoldingsLargest ETF holdings with weights, allocation percentages, and market values/holdings/top-holdingsCall $0.0004
Market PriceCurrent market price snapshot with change, volume, bid/ask, and market status data/market-priceCall $0.0001
Metrics & DividendsDividend data, returns, profitability, growth, leverage, and business quality metrics/metricsCall $0.0002
NewsETF-related news articles and press releases/newsCall $0.00015 + Row $0.00005
Options ChainOptions chain data with pricing, volume, open interest, and implied volatility/options/chainCall $0.00015 + Row $0.00005
Option Contract DetailsIndividual option contract data with pricing, volume, OI, IV, and underlying price/options/contractsCall $0.0004
Option ExpirationsAvailable option expiration dates for a selected ticker/options/expirationsCall $0.0004
ProfileETF issuer, inception date, legal structure, category, and fund description/profileCall $0.0004
SearchGlobal ETF search with metadata, pricing snapshots, and fund identifiers/searchCall $0.0004 + Row $0.001
Search LiteLightweight asset search with pricing, market cap, dividend yield, and key market metrics/search-liteCall $0.0001 + Row $0.0001
Annual Return HistoryMulti-year ETF return history across calendar periods/statistics/annual-returnsCall $0.0008
Statistics SnapshotFund statistics including flows, volumes, ratios, returns, and category metrics/statistics/generalCall $0.0015
Risk & Factor MetricsVolatility, beta, alpha, Sharpe, Treynor, standard deviation, and factor metrics/statistics/risksCall $0.0015
SummaryETF snapshot with price, NAV, category data, returns, and key fund metrics/summaryCall $0.0023
Summary LiteCompany or fund snapshot with profile details, valuation ratios, pricing, and market overview/summary-liteCall $0.0002
DataDescriptionEndpoint(s)Price
Filing EventsCompany filing events with filing dates, form types, document metadata, and source URLs/eventsCall $0.00015 + Row $0.00005
Historical PricesDaily OHLCV price history with adjusted prices and historical coverage/historiesCall $0.0002 + Row $0.00001
Holdings OverviewAggregated holdings overview with allocation breakdowns, exposure data, and valuation metrics/holdings/generalCall $0.0004
Top 10 HoldingsLargest fund holdings with weights, allocation percentages, and market values/holdings/top-holdingsCall $0.0004
Market PriceCurrent market price snapshot with change, volume, bid/ask, and market status data/market-priceCall $0.0001
Metrics & DividendsDividend data, returns, profitability, growth, leverage, and business quality metrics/metricsCall $0.0002
NewsFund-related news articles and press releases/newsCall $0.00015 + Row $0.00005
ProfileFund description, family, inception date, and legal information/profileCall $0.0004
SearchGlobal fund search with metadata, pricing snapshots, and fund identifiers/searchCall $0.0004 + Row $0.001
Search LiteLightweight asset search with pricing, market cap, dividend yield, and key market metrics/search-liteCall $0.0001 + Row $0.0001
Annual & Trailing Return HistoryMulti-year annual and trailing return history/statistics/annual-returnsCall $0.0008
Statistics SnapshotTrailing returns, category averages, load-adjusted returns, ranks, and up/down year statistics/statistics/generalCall $0.0015
Risk & Factor MetricsAlpha, beta, Sharpe, Treynor, R-squared, standard deviation, and return metrics by horizon/statistics/risksCall $0.0015
SummaryFund snapshot with NAV, price data, category information, and core metrics/summaryCall $0.0023
Summary LiteCompany or fund snapshot with profile details, valuation ratios, pricing, and market overview/summary-liteCall $0.0002

FinImpulse API testen

Flexible Preise für wachsende Produkte

Die Preise skalieren mit API-Requests, zurückgegebenem Datenvolumen und Infrastrukturnutzung.

Die Preise passen sich an:

  • Request-Volumen
  • Größe der zurückgegebenen Datensätze
  • historische Abdeckung
  • Aktualisierungshäufigkeit

Geeignet für:

  • Prototypen
  • interne Tools
  • Automatisierungssysteme
  • Produktivumgebungen

Die Nutzung steigt typischerweise durch:

  • Mehr Assets Größere Universen, Watchlists, Portfolios oder Abdeckung
  • Mehr historische Tiefe Längere Zeiträume und erweiterte Datensätze
  • Häufigere Updates Geplante Aktualisierungen, Alerts und Automatisierungsworkflows

Deployment-Optionen für Finanz-APIs

Entwickelt für direkten API-Zugriff, Automatisierungssysteme, KI-Integrationen und Sandbox-Tests.

REST API

Konzipiert für direkte Integrationen, No-Code-Workflows, KI-Systeme und skalierbare Bereitstellung.

n8n

No-Code-Workflow-Automatisierung für Reporting, Betriebssysteme und Produkt-Pipelines.
Make

make

Visuelle Automatisierung für SaaS-Systeme, Geschäftsprozesse und skalierbare Workflows.

MCP Server

Selbst gehostete Finanzinfrastruktur für KI-Systeme, Agent-Workflows und Modellintegrationen.

Remote MCP

Gehostetes MCP-Deployment für KI-Integrationen ohne Infrastrukturverwaltung.

Sandbox & Developer Tools

Sandbox-Tokens, Testguthaben, API-Verwaltung und Validierungstools für ein sicheres Deployment.

Auf Live-Finanzdatensätze zugreifen

Practical FinImpulse financial data use cases

Real examples of how to turn financial data into dashboards, analytics, automations, and AI-powered tools.

Asset Discovery & Market Snapshots

Snapshots

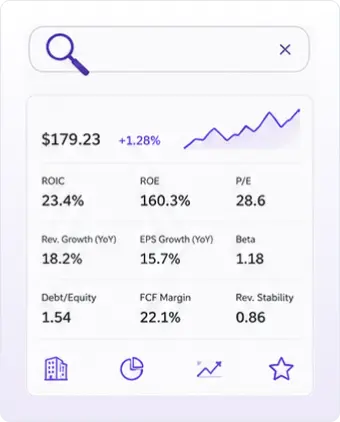
Search stocks, ETFs, and mutual funds with pricing, dividends, valuation, profitability, growth, risk metrics, and exchange metadata in a single request. The endpoint combines market data with pre-calculated financial indicators including ROIC, ROE, Free Cash Flow Margin, Revenue Growth, EPS Growth, Revenue Stability, Beta, and Debt-to-Equity.

Typical use:
  • Asset search & autocomplete
  • Asset overview pages
  • Watchlists & portfolios
  • Stock, ETF & fund screeners
  • Market dashboards
  • Asset comparison tools
  • AI-powered discovery

Financial Statements & Valuation History

valuation history

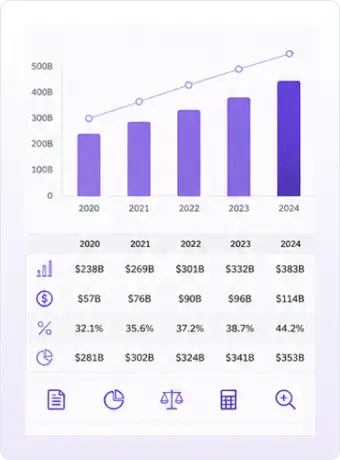
Access structured financial statements, valuation history, and company fundamentals across multiple years of reporting. Retrieve income statements, balance sheets, cash flow statements, financial summaries, and valuation metrics for up to 85,000 assets. Analyze company performance, track financial trends, calculate custom ratios, and build valuation models without processing raw filings.

Typical use:
  • Company fundamentals pages
  • Revenue & earnings trend charts
  • Valuation tracking
  • Financial dashboards
  • Ratio calculations
  • Fundamental screeners
  • AI-powered financial analysis

ETF Holdings & Portfolio Exposure

portfolio exposure

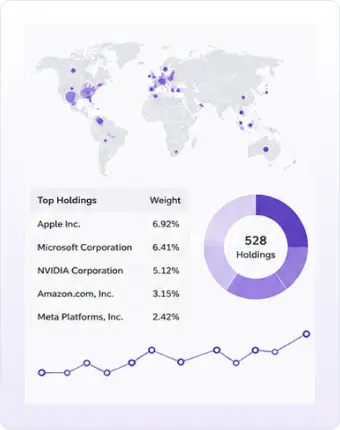
Access allocation breakdowns, exposure metrics, and full holdings data for up to 8,000 ETFs, including historical holdings snapshots collected daily since April 2026. Analyze portfolio concentration, compare funds, monitor allocation changes, and track how holdings evolve over time.

Typical use:
  • ETF profile pages
  • Portfolio exposure analysis
  • Fund comparison tools
  • Holdings tables
  • Concentration analysis
  • Allocation dashboards
  • AI-powered ETF research

Zentrale Vorteile der FinImpulse-Infrastruktur

  • Sandbox-API-Token
  • 1 $ Testguthaben
  • IP-Whitelisting
  • MCP-Support
  • REST-API-Zugriff
  • n8n- und Make-Integrationen

Mit der FinImpulse API loslegen