Precios transparentes de la API para productos financieros escalables

Pague solo por las peticiones y el volumen de datos devueltos en acciones, ETF, fondos de inversión, estados financieros, conjuntos de datos de analistas, posiciones y mercados de opciones.

Cómo funcionan los precios de la API de FinImpulse

Precios basados en el uso, pensados para infraestructura financiera escalable, flujos de trabajo de automatización y despliegues en producción.

Precios por llamada + fila

El precio se basa en las peticiones a la API y en el tamaño del conjunto de datos devuelto.

Acceso a nivel de endpoint

Utilice solo los conjuntos de datos y las categorías de infraestructura que su producto necesita.

Pruebas en el sandbox

Pruebe integraciones con tokens de sandbox, respuestas en caché y entornos aislados.

Crédito para desarrolladores

Empiece a probar la infraestructura con el crédito de API incluido y conjuntos de datos en tiempo real.

Escalado listo para producción

Escale de prototipos a sistemas en producción sin cambiar las capas de infraestructura.

Gestión segura de tokens

Gestione tokens de API en vivo, de sandbox y personalizados, con lista blanca de IP opcional.

Precios de la API por conjuntos de datos financieros

Precios estructurados para acciones, ETF y fondos de inversión que abarcan datos de mercado, estados financieros, analítica, posiciones y opciones.

DataDescriptionEndpoint(s)Price
Analyst CoverageAnalyst-level coverage records with ratings, sentiment, targets, and scores/analysis/analystsCall $0.0008 + Row $0.00015
Earnings & EstimatesEarnings estimates, EPS history, revenue data, revisions, and growth metrics/analysis/earningsCall $0.0008 + Row $0.00015
Analyst RecommendationsHistorical analyst recommendation breakdown across Buy, Hold, and Sell ratings/analysis/recommendationsCall $0.0008 + Row $0.00015
Analyst Rating ActionsAnalyst upgrades, downgrades, reiterations, and price target changes/analysis/upgrades-downgradesCall $0.0008 + Row $0.00015
Filing EventsCompany filing events with filing dates, form types, document metadata, and source URLs/eventsCall $0.00015 + Row $0.00005
Balance SheetMulti-period assets, liabilities, and shareholder equity data/financials/balance_sheetCall $0.0008 + Report $0.001
Cash Flow StatementMulti-period operating, investing, and financing cash flow statements/financials/cash_flowCall $0.0008 + Report $0.001
Income StatementMulti-period revenue, expenses, and earnings statements/financials/income_statementCall $0.0008 + Report $0.001
Valuation HistoryHistorical valuation ratios including P/E, P/S, P/B, and EV/EBITDA/financials/valuation_measuresCall $0.0008 + Report $0.00005
Historical PricesDaily OHLCV price history with adjusted prices and long-term historical coverage/historiesCall $0.0002 + Row $0.00001
Ownership OverviewInstitutional and insider ownership overview with ownership percentages and activity/holders/generalCall $0.0004
Insider RosterCorporate insiders, executives, and officer records/holders/insidersCall $0.0008 + Row $0.0002
Insider TransactionsHistorical insider buying and selling transactions/holders/insiders-transactionsCall $0.0008 + Row $0.0002
Top Institutional HoldersLargest institutional holders with position size and portfolio allocation/holders/institutionalCall $0.0008 + Row $0.0002
Top Mutual Fund HoldersLargest mutual fund holders with position size and allocation data/holders/mutual-fundsCall $0.0008 + Row $0.0002
Market PriceCurrent market price snapshot with change, volume, bid/ask, and market status data/market-priceCall $0.0001
Metrics & DividendsDividend data, returns, profitability, growth, leverage, and business quality metrics/metricsCall $0.0002
NewsStock-related news articles and press releases/newsCall $0.00015 + Row $0.00005
Options ChainOptions chain data with pricing, volume, open interest, and implied volatility/options/chainCall $0.00015 + Row $0.00005
Option Contract DetailsIndividual option contract data with pricing, volume, OI, IV, and underlying price/options/contractsCall $0.0004
Option ExpirationsAvailable option expiration dates for a selected ticker/options/expirationsCall $0.0004
ProfileCompany profile data including description, industry, address, and executives/profileCall $0.0004
SearchGlobal stock search with metadata, pricing snapshots, and profile identifiers/searchCall $0.0004 + Row $0.001
Search LiteLightweight asset search with pricing, market cap, dividend yield, and key market metrics/search-liteCall $0.0001 + Row $0.0001
Annual Return HistoryMulti-year annual return history and performance tracking/statistics/annual-returnsCall $0.0008
Statistics SnapshotMarket statistics, ratios, margins, growth metrics, dividends, and analyst targets/statistics/generalCall $0.0015
Risk SnapshotVolatility, beta, short interest, and market risk indicators/statistics/risksCall $0.0015
SummaryStructured stock snapshot with pricing, valuation, dividends, profitability, and company overview/summaryCall $0.0023
Summary LiteCompany or fund snapshot with profile details, valuation ratios, pricing, and market overview/summary-liteCall $0.0002
DataDescriptionEndpoint(s)Price
Filing EventsCompany filing events with filing dates, form types, document metadata, and source URLs/eventsCall $0.00015 + Row $0.00005
Historical PricesDaily OHLCV price history with adjusted prices and historical coverage/historiesCall $0.0002 + Row $0.00001
Holdings OverviewAggregated holdings overview with allocation breakdowns, exposure data, and valuation metrics/holdings/generalCall $0.0004
All Holdings ListRetrieve the full holdings composition for a selected symbol and historical reporting date./holdings/historyCall $0.00015 + Row $0.000025
Holdings Reporting DatesAvailable historical holdings reporting dates for the selected ETF/holdings/history/datesCall $0.0004
Top 10 HoldingsLargest ETF holdings with weights, allocation percentages, and market values/holdings/top-holdingsCall $0.0004
Market PriceCurrent market price snapshot with change, volume, bid/ask, and market status data/market-priceCall $0.0001
Metrics & DividendsDividend data, returns, profitability, growth, leverage, and business quality metrics/metricsCall $0.0002
NewsETF-related news articles and press releases/newsCall $0.00015 + Row $0.00005
Options ChainOptions chain data with pricing, volume, open interest, and implied volatility/options/chainCall $0.00015 + Row $0.00005
Option Contract DetailsIndividual option contract data with pricing, volume, OI, IV, and underlying price/options/contractsCall $0.0004
Option ExpirationsAvailable option expiration dates for a selected ticker/options/expirationsCall $0.0004
ProfileETF issuer, inception date, legal structure, category, and fund description/profileCall $0.0004
SearchGlobal ETF search with metadata, pricing snapshots, and fund identifiers/searchCall $0.0004 + Row $0.001
Search LiteLightweight asset search with pricing, market cap, dividend yield, and key market metrics/search-liteCall $0.0001 + Row $0.0001
Annual Return HistoryMulti-year ETF return history across calendar periods/statistics/annual-returnsCall $0.0008
Statistics SnapshotFund statistics including flows, volumes, ratios, returns, and category metrics/statistics/generalCall $0.0015
Risk & Factor MetricsVolatility, beta, alpha, Sharpe, Treynor, standard deviation, and factor metrics/statistics/risksCall $0.0015
SummaryETF snapshot with price, NAV, category data, returns, and key fund metrics/summaryCall $0.0023
Summary LiteCompany or fund snapshot with profile details, valuation ratios, pricing, and market overview/summary-liteCall $0.0002
DataDescriptionEndpoint(s)Price
Filing EventsCompany filing events with filing dates, form types, document metadata, and source URLs/eventsCall $0.00015 + Row $0.00005
Historical PricesDaily OHLCV price history with adjusted prices and historical coverage/historiesCall $0.0002 + Row $0.00001
Holdings OverviewAggregated holdings overview with allocation breakdowns, exposure data, and valuation metrics/holdings/generalCall $0.0004
Top 10 HoldingsLargest fund holdings with weights, allocation percentages, and market values/holdings/top-holdingsCall $0.0004
Market PriceCurrent market price snapshot with change, volume, bid/ask, and market status data/market-priceCall $0.0001
Metrics & DividendsDividend data, returns, profitability, growth, leverage, and business quality metrics/metricsCall $0.0002
NewsFund-related news articles and press releases/newsCall $0.00015 + Row $0.00005
ProfileFund description, family, inception date, and legal information/profileCall $0.0004
SearchGlobal fund search with metadata, pricing snapshots, and fund identifiers/searchCall $0.0004 + Row $0.001
Search LiteLightweight asset search with pricing, market cap, dividend yield, and key market metrics/search-liteCall $0.0001 + Row $0.0001
Annual & Trailing Return HistoryMulti-year annual and trailing return history/statistics/annual-returnsCall $0.0008
Statistics SnapshotTrailing returns, category averages, load-adjusted returns, ranks, and up/down year statistics/statistics/generalCall $0.0015
Risk & Factor MetricsAlpha, beta, Sharpe, Treynor, R-squared, standard deviation, and return metrics by horizon/statistics/risksCall $0.0015
SummaryFund snapshot with NAV, price data, category information, and core metrics/summaryCall $0.0023
Summary LiteCompany or fund snapshot with profile details, valuation ratios, pricing, and market overview/summary-liteCall $0.0002

Empiece a probar la API de FinImpulse

Precios flexibles para productos en crecimiento

Los precios se ajustan en función de las peticiones a la API, el volumen de datos devueltos y el uso de la infraestructura.

El precio se adapta a:

  • volumen de peticiones
  • tamaño de los datos devueltos
  • cobertura histórica
  • frecuencia de actualización

Adecuado para:

  • prototipos
  • herramientas internas
  • sistemas de automatización
  • despliegues en producción

El uso suele aumentar con:

  • Más activos Universos más amplios, listas de seguimiento, carteras o mayor cobertura
  • Mayor profundidad histórica Rangos de tiempo más largos y conjuntos de datos más extensos
  • Actualizaciones más frecuentes Actualizaciones programadas, alertas y flujos de trabajo de automatización

Opciones de despliegue para APIs financieras

Pensado para el acceso directo a la API, sistemas de automatización, integraciones de IA y pruebas en el sandbox.

REST API

Diseñado para integraciones directas, flujos de trabajo sin código, sistemas de IA y despliegue escalable.

n8n

Automatización de workflows no-code para informes, sistemas de operaciones y pipelines de producto.
Make

make

Automatización visual para sistemas SaaS, operaciones de negocio y workflows escalables.

MCP Server

Infraestructura financiera autohospedada para sistemas de IA, workflows de agentes e integraciones de modelos.

Remote MCP

Despliegue de MCP alojado para integraciones de IA sin necesidad de gestionar la infraestructura.

Sandbox y herramientas para desarrolladores

Tokens de sandbox, crédito de prueba, gestión de la API y herramientas de validación para un despliegue seguro.

Acceda a conjuntos de datos financieros en tiempo real

Practical FinImpulse financial data use cases

Real examples of how to turn financial data into dashboards, analytics, automations, and AI-powered tools.

Asset Discovery & Market Snapshots

Snapshots

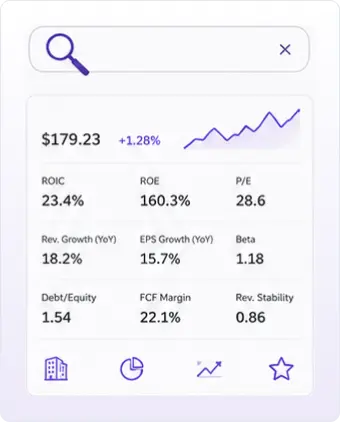
Search stocks, ETFs, and mutual funds with pricing, dividends, valuation, profitability, growth, risk metrics, and exchange metadata in a single request. The endpoint combines market data with pre-calculated financial indicators including ROIC, ROE, Free Cash Flow Margin, Revenue Growth, EPS Growth, Revenue Stability, Beta, and Debt-to-Equity.

Typical use:
  • Asset search & autocomplete
  • Asset overview pages
  • Watchlists & portfolios
  • Stock, ETF & fund screeners
  • Market dashboards
  • Asset comparison tools
  • AI-powered discovery

Financial Statements & Valuation History

valuation history

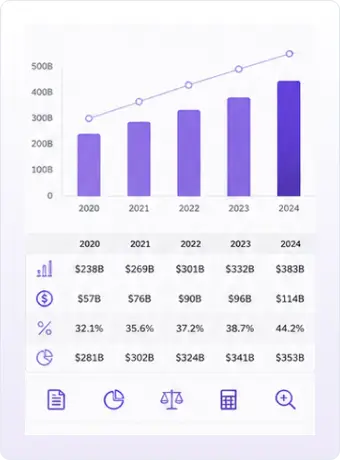
Access structured financial statements, valuation history, and company fundamentals across multiple years of reporting. Retrieve income statements, balance sheets, cash flow statements, financial summaries, and valuation metrics for up to 85,000 assets. Analyze company performance, track financial trends, calculate custom ratios, and build valuation models without processing raw filings.

Typical use:
  • Company fundamentals pages
  • Revenue & earnings trend charts
  • Valuation tracking
  • Financial dashboards
  • Ratio calculations
  • Fundamental screeners
  • AI-powered financial analysis

ETF Holdings & Portfolio Exposure

portfolio exposure

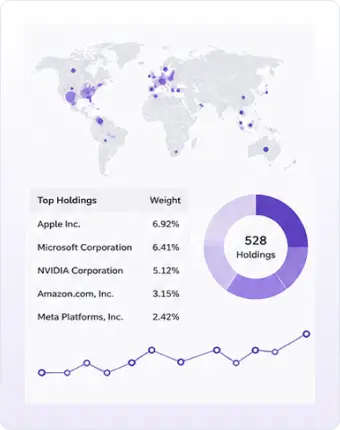
Access allocation breakdowns, exposure metrics, and full holdings data for up to 8,000 ETFs, including historical holdings snapshots collected daily since April 2026. Analyze portfolio concentration, compare funds, monitor allocation changes, and track how holdings evolve over time.

Typical use:
  • ETF profile pages
  • Portfolio exposure analysis
  • Fund comparison tools
  • Holdings tables
  • Concentration analysis
  • Allocation dashboards
  • AI-powered ETF research

Ventajas de la infraestructura central de FinImpulse

  • Token de API para el sandbox
  • Crédito de prueba de 1 $
  • Lista blanca de IP
  • Soporte de MCP
  • Acceso a la API REST
  • Integraciones con n8n y Make

Empieza a crear con la API de FinImpulse