Financial Statement Structure: Complete Guide & Excel Templates

At a high level, financial statements come down to a few figures: revenue, net income, assets, debt, and cash flow. The difficulty starts when you need the full structure.
A real Income Statement, Balance Sheet, or Cash Flow Statement can contain dozens or even hundreds of line items, nested sections, subtotals, accounting adjustments, and company-specific fields. Finding a normalized version you can reuse for analysis, dashboards, financial models, or AI workflows takes significant effort.
This guide brings that structure together in one place. You’ll find:
- the hierarchy of the Income Statement, Balance Sheet, and Cash Flow Statement
- guidance on how to analyze each statement
- downloadable Excel templates with detailed line items
- examples of how to use the structure in a financial dashboard
- access to the same financial data through the FinImpulse REST API
- MCP access for AI and LLM applications
Use the templates as a starting point for your own financial interface or data model, while FinImpulse provides the underlying financial statement data programmatically.
Download the financial statement templates: Income Statement · Balance Sheet · Cash Flow Statement
If you do not need API access and simply want to explore structured financial statements, you can use the FinImpulse Dashboard to view Income Statements, Balance Sheets, and Cash Flow Statements directly in the interface.
Income Statement
What the Income Statement Shows
The Income Statement shows how a company generates revenue and turns it into net income over a specific reporting period.
It connects the main stages of financial performance — from revenue and cost of revenue to operating income, taxes, net income, and earnings per share. Because it covers a period rather than a single point in time, it is one of the primary statements used to measure growth and changes in profitability.
Main Income Statement Sections
At a high level, the Income Statement can be organized into:
- Revenue
- Cost of Revenue
- Gross Profit
- Operating Expenses
- Operating Income
- Non-Operating Items
- Pretax Income
- Taxes
- Net Income
- EPS
Each section may contain multiple levels of underlying line items. The exact structure varies by company and industry.
The detailed Income Statement structure:
Total Revenuetotal_revenue
operating_revenueexcise_taxesCost Of Revenuecost_of_revenue
depreciation_amortization_depletion_income_statementDepreciation And Amortizationdepreciation_and_amortization_in_income_statement
depreciation_income_statementamortization_of_intangibles_income_statementdepletion_income_statementamortizationreconciled_depreciationinsurance_and_claimsrent_and_landing_feesreconciled_cost_of_revenuegross_profitOperating Expenseoperating_expense
research_and_developmentSelling General And Administrationselling_general_and_administration
selling_and_marketing_expenseGeneral And Administrative Expensegeneral_and_administrative_expense
salaries_and_wagesother_gand_aother_operating_expensesimpairment_of_capital_assetsother_special_chargesrent_expense_supplementalprovision_for_doubtful_accountsOperating Incomeoperating_income
total_operating_income_as_reportedrestructuring_and_mergern_acquisitionOther Income Expenseother_income_expense
other_non_operating_income_expensesspecial_income_chargestotal_other_finance_costgain_on_sale_of_businessgain_on_sale_of_ppegain_on_sale_of_securitysecurities_amortizationInterest Incomeinterest_income
interest_income_non_operatingInterest Expenseinterest_expense
interest_expense_non_operatingNet Interest Incomenet_interest_income
net_non_operating_interest_income_expenseEarnings From Equity Interestearnings_from_equity_interest
earnings_from_equity_interest_net_of_taxpretax_incomeTax Provisiontax_provision
other_taxestax_rate_for_calcstax_effect_of_unusual_itemsNet Income Including Noncontrolling Interestsnet_income_including_noncontrolling_interests
Net Income From Continuing Operation Net Minority Interestnet_income_from_continuing_operation_net_minority_interest
net_income_from_tax_loss_carryforwardnet_income_discontinuous_operationsnet_income_continuous_operationsnet_income_from_continuing_and_discontinued_operationnet_income_extraordinaryminority_interestsNet Incomenet_income
Net Income Common Stockholdersnet_income_common_stockholders
diluted_ni_availto_com_stockholdersotherunder_preferred_stock_dividendpreferred_stock_dividendsBasic EPSbasic_eps
basic_average_sharesbasic_continuous_operationsbasic_discontinuous_operationsbasic_extraordinarybasic_accounting_changebasic_eps_other_gains_lossescontinuing_and_discontinued_basic_epsnormalized_basic_epsreported_normalized_basic_epstax_loss_carryforward_basic_epsDiluted EPSdiluted_eps
average_dilution_earningsdiluted_average_sharesdiluted_continuous_operationsdiluted_discontinuous_operationsdiluted_extraordinarydiluted_accounting_changediluted_eps_other_gains_lossescontinuing_and_discontinued_diluted_epsnormalized_diluted_epsreported_normalized_diluted_epstax_loss_carryforward_diluted_epsdividend_per_shareebitEBITDAebitda
normalized_ebitdanormalized_incometotal_expensesTotal Unusual Itemstotal_unusual_items
total_unusual_items_excluding_goodwillwrite_offWhy the Income Statement Matters
The Income Statement helps explain where a company's net income comes from and what drives changes in profitability.
Revenue growth alone does not show whether the business is improving its margins. Cost of revenue may grow faster than sales, operating expenses may increase, or interest and tax expenses may materially affect the final result.
Looking at several reporting periods together makes it possible to distinguish between growth driven by the core business and changes caused by expenses, accounting items, restructuring, financing costs, or other factors.
It is also the basis for many commonly used financial metrics, including gross margin, operating margin, net margin, EPS growth, EBITDA, and various profitability ratios.
For company comparison and financial modeling, the detailed structure matters. Two companies can report similar net income while having very different revenue growth, margins, operating expenses, and financing costs.
Using Income Statement Data
A useful Income Statement analysis usually starts at the top and follows the statement down to Net Income.
| Analysis | What to Look At |
|---|---|
| Revenue growth | Compare revenue across annual and quarterly periods and calculate YoY or QoQ changes |
| Gross profitability | Compare Revenue, Cost of Revenue, and Gross Profit to understand changes in gross margin |
| Operating efficiency | Track R&D, SG&A, marketing, and other operating expenses relative to revenue |
| Operating performance | Compare Operating Income and Operating Margin across periods |
| Non-operating impact | Review interest income, interest expense, gains, losses, and other non-operating items |
| Tax impact | Compare Pretax Income with Tax Provision and effective tax rates |
| Bottom-line performance | Track Net Income, Basic EPS, Diluted EPS, and share-count changes |
The most useful analysis usually comes from comparing several periods, rather than reading a single report. With up to 5 years of quarterly financial statements available in FinImpulse, you can track how revenue, margins, operating costs, net income, and other key metrics change over time and identify longer-term trends.
For example, if revenue increased by 20% while operating income increased by 35%, the next step is to determine which expense categories grew more slowly than revenue. If net income moved differently from operating income, the explanation may instead lie below the operating line — interest expense, gains or losses, taxes, or other items.
Income Statement data can also be combined with Balance Sheet and Cash Flow data to validate whether accounting earnings are supported by changes in assets, liabilities, and cash generation.
Income Statement Data API
FinImpulse provides Income Statement data in two ways: through the REST API for applications and data pipelines, or through the MCP Server for AI systems.
REST API
Use: POST /v1/financials/income_statement
The endpoint returns detailed Income Statement fields for a selected ticker and supports annual, quarterly, and trailing reporting intervals, as well as date-range filtering.
This is suitable for:
- financial dashboards
- historical financial tables
- financial models
- company comparison tools
- automated reporting
- data warehouses and internal systems
Income Statement API Documentation↗
MCP for AI Applications
For AI applications, the same financial data can be accessed through the FinImpulse MCP Server.
Instead of building a separate integration between an LLM and every financial endpoint, an MCP-compatible client can request financial statements through a standardized tool interface. FinImpulse MCP currently supports financial statements alongside market data, statistics, ownership, analyst data, holdings, and other datasets.
This can be used to build workflows such as:
“Compare NVIDIA's annual revenue, operating income, and net income over the last four years and explain what changed.”
The AI client can retrieve the underlying structured data through MCP and use it directly as context for analysis.
FinImpulse MCP supports clients such as ChatGPT, Claude, Cursor, VS Code, and other MCP-compatible environments.
FinImpulse MCP Server Documentation↗
Download the Income Statement Template
The FinImpulse API provides the financial data fields and values, while your application determines how those fields are grouped and displayed.
If you are building a Financials page or a company dashboard, this template can serve as the starting structure for the interface.
It includes the normalized hierarchy of Income Statement fields, including parent sections and nested line items, so you do not need to design the statement structure from scratch.
Download Income Statement Structure (.xlsx)
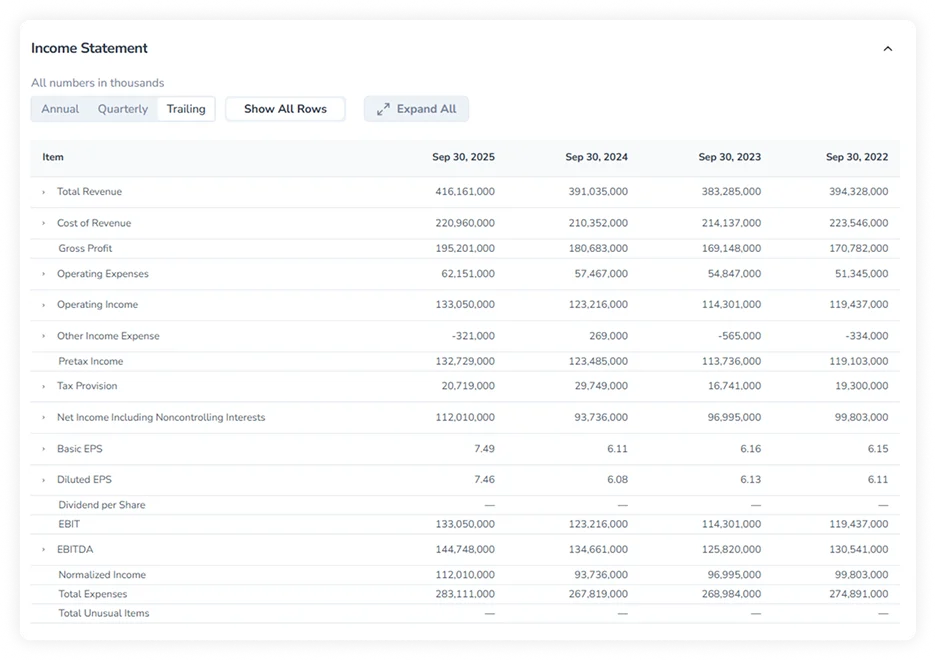
The same hierarchy can also be seen in the FinImpulse Dashboard. Open any stock, go to Financials → Income Statement, and expand individual sections to see how the company's actual results break down into detailed line items.
Balance Sheet
What the Balance Sheet Shows
The Balance Sheet shows what a company owns, what it owes, and the value attributable to shareholders at a specific point in time. Its basic accounting relationship is:
Assets = Liabilities + Equity
Assets show what the company owns or controls — cash, receivables, inventory, property, investments, and other resources. Liabilities and Equity show how those assets are financed — through debt and other obligations, or through shareholders’ capital and accumulated earnings.
Unlike the Income Statement, which covers financial performance over a period, the Balance Sheet is a snapshot at a specific reporting date. Comparing Balance Sheets across quarters helps track changes in liquidity, debt, working capital, asset structure, and equity.
Main Balance Sheet Sections
At a high level, the Balance Sheet consists of two sides:
- Assets
- Liabilities + Shareholders’ Equity
Assets are typically divided into current and non-current assets. The other side includes current liabilities, non-current liabilities, and shareholders’ equity.
More detailed sections may include cash, receivables, inventory, property and equipment, investments, debt, leases, retained earnings, treasury stock, and other balance sheet accounts.
The detailed Balance Sheet structure:
Total Assetstotal_assets
Current Assetscurrent_assets
Cash, Cash Equivalents And Short Term Investmentscash_cash_equivalents_and_short_term_investments
Cash And Cash Equivalentscash_and_cash_equivalents
cash_financialcash_equivalentsrestricted_cashother_short_term_investmentstrading_securitiesavailable_for_sale_securitiesheld_to_maturity_securitieshedging_assets_currentReceivablesreceivables
accounts_receivablegross_accounts_receivableallowance_for_doubtful_accounts_receivablereceivables_adjustments_allowancesaccrued_interest_receivableother_receivablesnotes_receivableloans_receivabletaxes_receivableduefrom_related_parties_currentInventoryinventory
raw_materialsfinished_goodswork_in_processother_inventoriesinventories_adjustments_allowancesprepaid_assetscurrent_deferred_assetscurrent_deferred_taxes_assetsother_current_assetsassets_held_for_sale_currentTotal Non Current Assetstotal_non_current_assets
Net PPEnet_ppe
gross_ppeaccumulated_depreciationbuildings_and_improvementsmachinery_furniture_equipmentland_and_improvementsconstruction_in_progressinvestment_propertiespropertiesleasesother_propertiesGoodwill And Other Intangible Assetsgoodwill_and_other_intangible_assets
goodwillother_intangible_assetsInvestments And Advancesinvestments_and_advances
investmentin_financial_assetsother_investmentsinvestments_in_other_ventures_under_equity_methodinvestmentsin_associatesat_costinvestmentsin_joint_venturesat_costinvestmentsin_subsidiariesat_costlong_term_equity_investmentFinancial Assetsfinancial_assets
financial_assets_designatedas_fair_value_through_profitor_loss_totalnon_current_accounts_receivablenon_current_note_receivablesnon_current_deferred_assetsnon_current_deferred_taxes_assetsnon_current_prepaid_assetsother_non_current_assetsduefrom_related_parties_non_currentTotal Liabilities Net Minority Interesttotal_liabilities_net_minority_interest
Current Liabilitiescurrent_liabilities
accounts_payablepayablespayables_and_accrued_expensescurrent_accrued_expensesincome_tax_payableinterest_payableCurrent Debtcurrent_debt
current_notes_payablecommercial_paperline_of_creditother_current_borrowingscurrent_capital_lease_obligationcurrent_debt_and_capital_lease_obligationcurrent_deferred_liabilitiescurrent_deferred_taxes_liabilitiescurrent_deferred_revenuedividends_payabledueto_related_parties_currentpensionand_other_post_retirement_benefit_plans_currentcurrent_provisionsother_payableother_current_liabilitiestotal_tax_payableTotal Non Current Liabilities Net Minority Interesttotal_non_current_liabilities_net_minority_interest
Long Term Debt And Capital Lease Obligationlong_term_debt_and_capital_lease_obligation
long_term_debtlong_term_capital_lease_obligationcapital_lease_obligationslong_term_provisionsnon_current_deferred_liabilitiesnon_current_deferred_taxes_liabilitiesnon_current_deferred_revenuenon_current_accrued_expensestradeand_other_payables_non_currentderivative_product_liabilitiesliabilities_heldfor_sale_non_currentdueto_related_parties_non_currentnon_current_pension_and_other_postretirement_benefit_plansminimum_pension_liabilitiesdefined_pension_benefitemployee_benefitsother_non_current_liabilitiesTotal Equity Gross Minority Interesttotal_equity_gross_minority_interest
Stockholders Equitystockholders_equity
Common Stock Equitycommon_stock_equity
common_stockcapital_stockother_capital_stockadditional_paid_in_capitalshare_issuedordinary_shares_numberPreferred Stock Equitypreferred_stock_equity
preferred_stockpreferred_shares_numberretained_earningsTreasury Stocktreasury_stock
treasury_shares_numberrestricted_common_stocknet_tangible_assetstangible_book_valueOther Equity Adjustmentsother_equity_adjustments
foreign_currency_translation_adjustmentsunrealized_gain_lossgains_losses_not_affecting_retained_earningsfixed_assets_revaluation_reserveother_equity_interestpreferred_securities_outside_stock_equitygeneral_partnership_capitallimited_partnership_capitaltotal_partnership_capitalminority_interesttotal_debttotal_capitalizationworking_capitalnet_debtinvested_capitalWhy the Balance Sheet Matters
The Balance Sheet provides information that cannot be seen from earnings alone.
A company with positive net income may still have high debt, limited liquidity, large working-capital requirements, or rapidly increasing liabilities. At the same time, a company reporting modest current earnings may hold substantial cash, securities, or other assets.
It is therefore particularly useful for understanding liquidity, solvency, capital structure, debt exposure, working capital, and asset composition.
Changes between reporting periods can also reveal how the company is financing its operations. Growth in assets may be funded through retained earnings, new debt, equity issuance, or increases in operating liabilities.
Balance Sheet data also provides the inputs for ratios such as Current Ratio, Debt-to-Equity, Return on Assets, Return on Equity, book value, working capital, and net debt.
Using Balance Sheet Data
Balance Sheet analysis is generally based on both the composition of the statement and the changes in individual balances over time.
| Analysis | What to Look At |
|---|---|
| Liquidity | Cash, short-term investments, receivables, Current Assets, and Current Liabilities |
| Working capital | Changes in receivables, inventory, payables, and other current accounts |
| Debt | Current Debt, Long-Term Debt, Total Debt, and Net Debt |
| Capital structure | Compare debt, shareholder equity, and total capitalization |
| Asset composition | Track PPE, goodwill, intangible assets, investments, and financial assets |
| Equity | Review retained earnings, paid-in capital, treasury stock, and other equity components |
| Solvency | Compare liabilities with assets, equity, and cash-generating capacity |
A single Balance Sheet can show the current position, but the more useful information usually comes from changes between reporting dates.
For example, rapidly growing revenue combined with rapidly growing receivables can indicate that more capital is being tied up in customer balances. Increasing debt can be analyzed alongside cash levels and operating cash flow to assess how the company's leverage is evolving.
Balance Sheet Data API
REST API
Use: POST /v1/financials/balance_sheet
The endpoint provides assets, liabilities, equity, debt, cash, working-capital components, and other Balance Sheet fields for annual and quarterly reporting periods. It can be used for company dashboards, financial modeling, ratio calculations, solvency analysis, screening, and historical financial databases.
Balance Sheet API Documentation↗
MCP for AI Applications
Balance Sheet data is also available through the FinImpulse MCP Server. This allows an AI application to retrieve structured company data and answer questions such as:
“How has Microsoft's cash position and total debt changed over the last four annual reports?”
or:
“Compare the working capital and debt structure of these three companies.”
The AI client retrieves the underlying financial data through MCP rather than relying on values extracted from unstructured web pages or PDFs. In FinImpulse MCP, Balance Sheet data is part of the Financial Statements tool group.
FinImpulse MCP Server Documentation↗
Download the Balance Sheet Template
If you are building your own financial dashboard, the template can be used as the presentation structure for Balance Sheet data returned by the API. It defines how individual Balance Sheet fields can be organized into Assets, Liabilities, Equity, and their underlying subgroups.
Download Balance Sheet Structure (.xlsx)
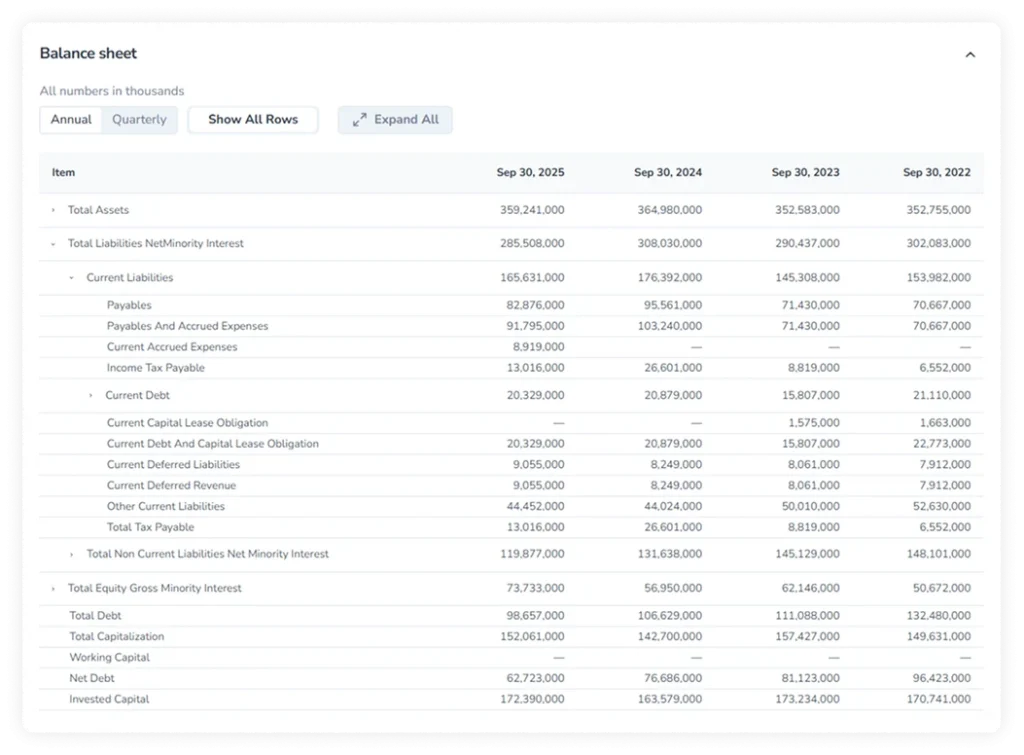
You can also see this structure implemented in the FinImpulse Dashboard. Open any stock and go to Financials → Balance Sheet to explore the expandable hierarchy and see how individual API fields are presented with actual data.
Cash Flow Statement
What the Cash Flow Statement Shows
The Cash Flow Statement explains how cash moved through a company during a reporting period. It connects operating performance with capital spending, financing activities, and the resulting change in the company's cash position.
At the highest level:
Operating Cash Flow + Investing Cash Flow + Financing Cash Flow → Change in Cash
Main Cash Flow Statement Sections
The structure consists primarily of:
- Operating Activities
- Investing Activities
- Financing Activities
- Cash Reconciliation
Detailed statements may also include working-capital adjustments, non-cash items, capital expenditure, acquisitions, debt issuance and repayment, dividends, share repurchases, and supplemental cash-flow disclosures.
The detailed Cash Flow Statement structure:
Operating Cash Flowoperating_cash_flow
Cash Flow From Continuing Operating Activitiescash_flow_from_continuing_operating_activities
cash_flowsfromusedin_operating_activities_directnet_income_from_continuing_operationsOperating Gains Lossesoperating_gains_losses
pension_and_employee_benefit_expensegain_loss_on_sale_of_ppenet_foreign_currency_exchange_gain_lossgain_loss_on_sale_of_businessgain_loss_on_investment_securitiesunrealized_gain_loss_on_investment_securitiesDepreciation And Amortizationdepreciation_and_amortization
Depreciation Amortization Depletiondepreciation_amortization_depletion
depreciationAmortization Cash Flowamortization_cash_flow
amortization_of_intangiblesamortization_of_securitiesdepletionDeferred Income Taxdeferred_income_tax
deferred_taxasset_impairment_chargestock_based_compensationprovisionand_write_offof_assetsother_non_cash_itemsearnings_losses_from_equity_investmentsChange In Working Capitalchange_in_working_capital
Change In Receivableschange_in_receivables
changes_in_account_receivableschange_in_inventorychange_in_prepaid_assetsChange In Payables And Accrued Expensechange_in_payables_and_accrued_expense
Change In Payablechange_in_payable
change_in_account_payablechange_in_dividend_payablechange_in_income_tax_payablechange_in_interest_payablechange_in_tax_payablechange_in_accrued_expensechange_in_other_current_assetschange_in_other_current_liabilitieschange_in_other_working_capitalother_cash_receiptsfrom_operating_activitiesother_cash_paymentsfrom_operating_activitiesreceiptsfrom_customersreceiptsfrom_government_grantsclassesof_cash_receiptsfrom_operating_activitiesclassesof_cash_paymentsInvesting Cash Flowinvesting_cash_flow
Cash Flow From Continuing Investing Activitiescash_flow_from_continuing_investing_activities
Net PPE Purchase And Salenet_ppe_purchase_and_sale
purchase_of_ppesale_of_ppeNet Intangibles Purchase And Salenet_intangibles_purchase_and_sale
purchase_of_intangiblessale_of_intangiblesNet Investment Properties Purchase And Salenet_investment_properties_purchase_and_sale
purchase_of_investment_propertiessale_of_investment_propertiesNet Business Purchase And Salenet_business_purchase_and_sale
purchase_of_businesssale_of_businessNet Investment Purchase And Salenet_investment_purchase_and_sale
purchase_of_investmentsale_of_investmentnet_other_investing_changesdividends_received_cfiinterest_received_cfiFinancing Cash Flowfinancing_cash_flow
Cash Flow From Continuing Financing Activitiescash_flow_from_continuing_financing_activities
Net Issuance Payments Of Debtnet_issuance_payments_of_debt
Net Long Term Debt Issuancenet_long_term_debt_issuance
long_term_debt_issuancelong_term_debt_paymentsNet Short Term Debt Issuancenet_short_term_debt_issuance
short_term_debt_issuanceshort_term_debt_paymentsNet Common Stock Issuancenet_common_stock_issuance
common_stock_issuancecommon_stock_paymentsNet Preferred Stock Issuancenet_preferred_stock_issuance
preferred_stock_issuancepreferred_stock_paymentsproceeds_from_stock_option_exercisedCash Dividends Paidcash_dividends_paid
common_stock_dividend_paidpreferred_stock_dividend_paidnet_other_financing_chargesinterest_paid_cffrepurchase_of_capital_stockissuance_of_capital_stockEnd Cash Positionend_cash_position
changes_in_casheffect_of_exchange_rate_changesBeginning Cash Positionbeginning_cash_position
other_cash_adjustment_inside_changein_cashother_cash_adjustment_outside_changein_cashIncome Tax Paid Supplemental Dataincome_tax_paid_supplemental_data
taxes_refund_paidtaxes_refund_paid_directexcess_tax_benefit_from_stock_based_compensationInterest Paid Supplemental Datainterest_paid_supplemental_data
interest_paid_directinterest_received_directinterest_paid_cfointerest_received_cfodividends_paid_directdividends_received_directdividend_paid_cfodividend_received_cfocapital_expenditurecapital_expenditure_reportedissuance_of_debtrepayment_of_debtfree_cash_flowCash Flow From Discontinued Operationcash_flow_from_discontinued_operation
cash_from_discontinued_operating_activitiescash_from_discontinued_investing_activitiescash_from_discontinued_financing_activitiesadjusted_geography_segment_datadomestic_salesforeign_salesDirect Method (optional disclosure)
paymentsto_suppliersfor_goodsand_servicespaymentson_behalfof_employeesWhy the Cash Flow Statement Matters
The Cash Flow Statement helps distinguish accounting profit from actual cash generation.
Net Income is based on accrual accounting and can include revenue that has not yet been collected, expenses that do not require current cash payments, and other non-cash items. Operating Cash Flow adjusts for these effects and shows how much cash the business generated from its operations.
Investing Cash Flow shows how the company is directing capital to assets, acquisitions, securities purchases, and other long-term uses. Financing Cash Flow shows how it raises or distributes capital through debt, equity, dividends, and share repurchases.
Together, these sections help answer questions such as whether operating activity generates enough cash to support capital expenditure, whether the company relies on external financing, and how management uses excess cash.
The statement is also the source of metrics such as Operating Cash Flow and Free Cash Flow.
Using Cash Flow Statement Data
Cash-flow analysis becomes most useful when individual sections are connected to the Income Statement and Balance Sheet.
| Analysis | What to Look At |
|---|---|
| Net income vs. cash | Compare Net Income with Operating Cash Flow |
| Cash generation | Track Operating Cash Flow across reporting periods |
| Working capital | Review changes in receivables, inventory, payables, and other working-capital items |
| Capital expenditure | Track purchases of PPE and other long-term assets |
| Free Cash Flow | Compare Operating Cash Flow with Capital Expenditure |
| Acquisitions & securities | Review business acquisitions, securities purchases, and asset sales |
| Financing | Track debt issuance, debt repayments, equity issuance, dividends, and share repurchases |
| Cash position | Reconcile beginning cash, cash movements, FX effects, and ending cash |
A company can report growing Net Income while Operating Cash Flow weakens. That difference may come from receivables, inventory, other working-capital movements, or non-cash accounting items.
Similarly, strong Operating Cash Flow does not automatically mean that cash available after capital spending is increasing. Capital expenditure and acquisitions can consume a significant portion of operating cash.
This makes the Cash Flow Statement particularly useful when evaluating the quality and sustainability of reported net income.
Cash Flow Statement Data API
REST API
Use: POST /v1/financials/cash_flow
The endpoint provides detailed operating, investing, and financing cash-flow fields across annual, quarterly, and trailing reporting periods. It can be used for cash-flow dashboards, Free Cash Flow calculations, capital-allocation analysis, financial modeling, company comparison, and historical data pipelines.
Cash Flow Statement API Documentation↗
MCP for AI Applications
Cash Flow data can also be queried through the FinImpulse MCP Server.
For example, an AI agent could receive a request such as:
“Explain why operating cash flow increased while net income decreased.”
or:
“Compare capital expenditure, free cash flow, dividends, and share repurchases over the last five reporting periods.”
The AI client can retrieve the relevant Cash Flow, Income Statement, and Balance Sheet data through the same MCP connection and use the combined dataset as structured context.
FinImpulse MCP Server Documentation↗
Download the Cash Flow Statement Template
The template provides the hierarchy needed to turn Cash Flow API fields into a structured financial table. It can be used as the basis for a Financials tab, a company profile, a reporting interface, an internal analytics tool, or a financial data dashboard.
Download Cash Flow Statement Structure (.xlsx)
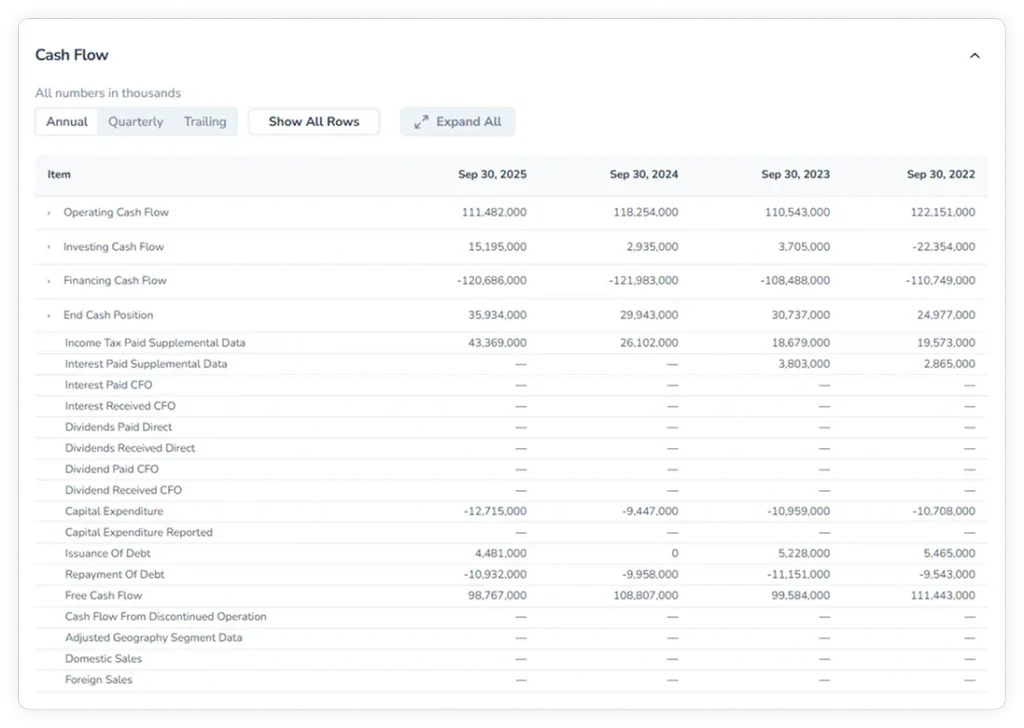
To see the same structure in a working interface, open any stock in the FinImpulse Dashboard and go to Financials → Cash Flow. The expandable sections show how operating, investing, financing, and underlying line items are organized, based on the company's reported figures.
From Financial Statements to Financial Metrics
Income Statements, Balance Sheets, and Cash Flow Statements provide the raw data behind many of the financial metrics used in company analysis.
Once the statements are combined, you can calculate indicators such as profitability margins, ROE, ROIC, debt-to-equity, growth rates, free cash flow metrics, and valuation multiples.
If you do not want to calculate all of these metrics yourself, FinImpulse also provides many of them as ready-to-use API fields.
The Financial Metrics API returns a focused set of profitability, growth, leverage, business quality, dividend, and performance metrics, including:
- Net Margin
- Return on Equity (ROE)
- Return on Invested Capital (ROIC)
- Debt-to-Equity
- Revenue Growth
- EPS Growth
- Free Cash Flow Margin
Explore the Financial Metrics API↗
For valuation analysis, the Valuation Measures API provides historical multiples derived from market prices and financial statement data, including P/E, EV/EBITDA, and P/B. These values align with financial reporting periods and can be retrieved for annual, quarterly, and trailing periods.
Explore the Valuation Measures API↗
So you can use FinImpulse at either level:
- Financial Statements — when you need the underlying accounting data and want to build your own calculations, models, or interfaces.
- Financial Metrics & Valuation Measures — when you need commonly used indicators already calculated and ready to use.