

Historical Prices API
Description
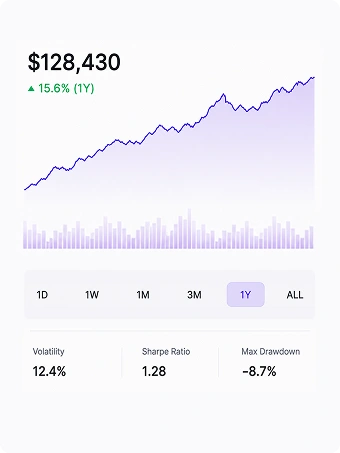
Historical Prices API returns structured historical market data for stocks, ETFs, mutual funds, and other supported assets. Retrieve OHLC prices, adjusted close, trading volume, dividends, stock splits, timestamps, and other historical market data using daily, weekly, monthly, or yearly intervals.
The endpoint is designed for applications that analyze historical market performance, calculate returns, compare assets, generate technical indicators, build custom visualizations, or export historical datasets. It can be used independently or combined with Market Price API, Summary API, and other FinImpulse endpoints to create complete financial dashboards and analytics platforms.
Interface Example
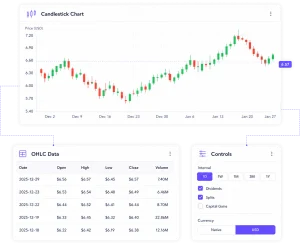
Output Example
NOKIA.HE — Nokia · Daily interval · USD-normalized
|
Date |
Open |
High |
Low |
Close |
Volume |
|---|---|---|---|---|---|
|
2025-12-29 |
$6.56 |
$6.57 |
$6.45 |
$6.57 |
7.40M |
|
2025-12-23 |
$6.53 |
$6.54 |
$6.48 |
$6.49 |
6.46M |
|
2025-12-22 |
$6.44 |
$6.52 |
$6.41 |
$6.44 |
8.70M |
|
2025-12-19 |
$6.33 |
$6.45 |
$6.32 |
$6.40 |
22.86M |
|
2025-12-18 |
$6.22 |
$6.42 |
$6.19 |
$6.38 |
12.16M |
How to Build this Workflow
This workflow is built using the following FinImpulse APIs
- Historical Prices API
- Search Lite API (optional)
- Market Price API (optional)
- Summary Lite API (optional)
Resources
API Cost Examples
| Scenario | APIs Used | Usage Example | Estimated Monthly Cost |
|---|---|---|---|
| Historical Prices (1Y) | Historical Prices API | 10,000 assets × 1Y of daily history | ≈ $9.06 |
| Historical Prices API (Calls) = $0.00015 10,000 assets × $0.00015 = $1.50 Historical Prices API (Rows) = $0.000003 10,000 assets × 252 days = 2,520,000 rows 2,520,000 rows × $0.000003 = $7.56 Total = $7.56 + $1.50 = $9.06 / month |
|||
| Historical Prices (5Y) | Historical Prices API | 10,000 assets × 5Y of daily history | ≈ $40.80 |
| Historical Prices API (Calls) = $0.00015 5 years × 252 days = 1260 rows > 1000 → 2 calls 10,000 assets × 2 × $0.00015 = $3.00 Historical Prices API (Rows) = $0.000003 10,000 assets × 252 days × 5 years = 12,600,000 rows 12,600,000 rows × $0.000003 = $37.80 Total = $37.80 + $3.00 = $40.80 / month |
|||
| Historical Prices (10Y) | Historical Prices API | 10,000 assets × 10Y of daily history | ≈ $80.10 |
| Historical Prices API (Calls) = $0.00015 10 years × 252 days = 2520 rows → 3 calls 10,000 assets × 3 × $0.00015 = $4.50 Historical Prices API (Rows) = $0.000003 10,000 assets × 252 days × 10 years = 25,200,000 rows 25,200,000 rows × $0.000003 = $75.60 Total = $75.60 + $4.50 = $80.10 / month |
|||
| Historical Prices (20Y) | Historical Prices API | 10,000 assets × 20Y of daily history | ≈ $160.20 |
| Historical Prices API (Calls) = $0.00015 20 years × 252 days = 5040 rows → 6 calls 10,000 assets × 6 × $0.00015 = $9.00 Historical Prices API (Rows) = $0.000003 10,000 assets × 252 days × 20 years = 50,400,000 rows 50,400,000 rows × $0.000003 = $151.20 Total = $151.20 + $9.00 = $160.20 / month |
|||
Disclaimer. The pricing examples above are calculated using the APIs shown in this workflow and represent typical usage scenarios. Static data can be cached client-side to reduce actual costs below these estimates, and the Sandbox environment is available for development and testing separately from production usage. Actual costs depend on the endpoints, datasets, response size, request frequency, caching strategy, and additional data included in your application.
FinImpulse provides financial data and analytics APIs only. AI-generated responses depend on the application, prompts, and language model used. FinImpulse does not provide investment advice, trading recommendations, or guarantee the accuracy of AI-generated conclusions.