
New Financial Metrics in the FinImpulse Filter Library
Explore new financial filters in FinImpulse — profitability, growth, leverage, and risk metrics are now available.
Identifying quality stocks involves more than sorting by price or market cap. Metrics such as free cash flow margin, return on invested capital, and revenue stability are among the primary indicators of business quality. But accessing them has typically meant opening each ticker page individually and manually assembling the picture.
To address this, the FinImpulse filter library has been expanded with 9 new filters that bring these metrics directly into the search workflow. They can be applied as screening conditions and added as columns to the results table, so the full comparison happens in a single view.
Filters Breakdown
All new filters are located in the financials category under “Add Filters”.
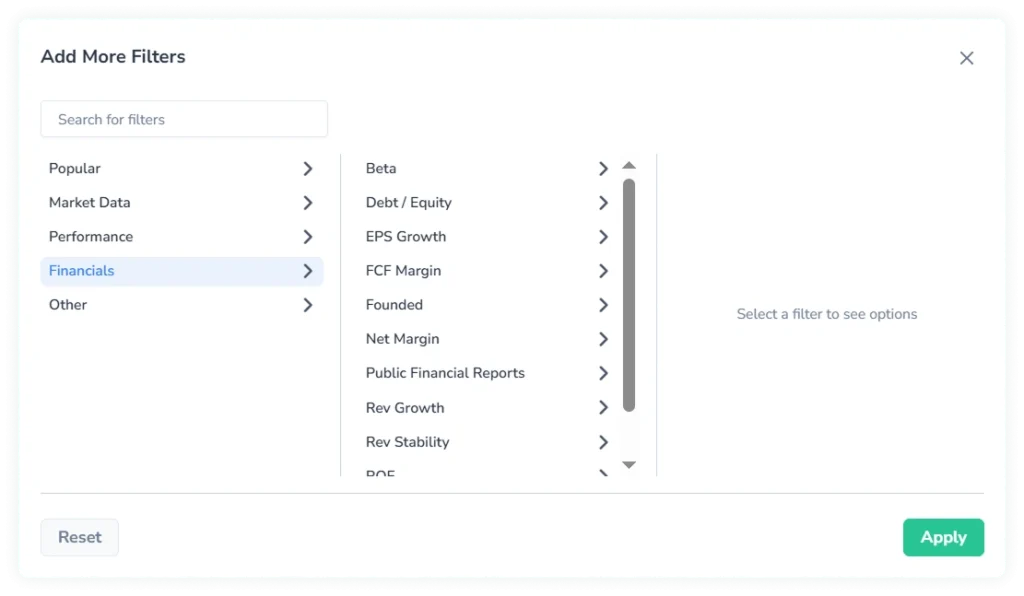
Each filter is a predefined quick filter — it offers a set of standard threshold ranges as well as a “Custom” option for entering a specific value.
1. FCF Margin
Free Cash Flow Margin measures how efficiently a company converts revenue into actual cash after capital expenditures. It is one of the more reliable indicators of cash generation quality, as it is not affected by non-cash accounting items the way net income is.
Predefined Ranges
- Negative (< 0%)
- Low (0% to 10%)
- Moderate (10% to 25%)
- High (> 25%)
2. ROIC
Return on Invested Capital measures how effectively a company generates profit from the total capital it has deployed — both debt and equity. It reflects whether a business generates value above its cost of capital, which makes it a core metric in quality-oriented screening.
Predefined Ranges
- Negative (< 0%)
- Low (0% to 10%)
- Moderate (10% to 25%)
- High (> 25%)
3. Net Margin
Net Margin shows what percentage of revenue remains as net income after all expenses, taxes, and interest have been accounted for. It is a direct measure of bottom-line efficiency and varies significantly by sector.
Predefined Ranges
- Negative (< 0%)
- Low (0% to 10%)
- Moderate (10% to 25%)
- High (> 25%)
4. ROE
Return on Equity measures how much profit a company generates relative to shareholders’ equity. High ROE can reflect strong operational performance, but it can also result from elevated financial leverage — which is why it is typically evaluated alongside Debt/Equity.
Predefined Ranges
- Negative (< 0%)
- Low (0% to 10%)
- Moderate (10% to 25%)
- High (> 25%)
5. Debt / Equity
Debt-to-Equity compares a company’s total liabilities to its shareholders’ equity, indicating the degree to which it is financed through borrowing. Higher values correspond to greater financial leverage and balance sheet risk.
Predefined Ranges
- Low (< 0.5)
- Moderate (0.5 to 1)
- High (1 to 2)
- Very High (> 2)
6. Revenue Growth
Revenue Growth measures the year-over-year percentage change in total revenue. It is the primary indicator of whether a business is expanding its top line and at what pace.
Predefined Ranges
- Declining (< 0%)
- Slow (0% to 10%)
- Moderate (10% to 30%)
- Fast (> 30%)
7. EPS Growth
EPS Growth measures the year-over-year percentage change in earnings per share. While revenue growth reflects top-line expansion, EPS growth captures whether that expansion is translating into per-share profitability — accounting for dilution and cost structure.
Predefined Ranges
- Declining (< 0%)
- Slow (0% to 10%)
- Moderate (10% to 30%)
- Fast (> 30%)
8. Revenue Stability
Revenue Stability is a score between 0 and 1 that reflects the consistency and predictability of a company’s revenue over time. Higher scores indicate more consistent, predictable revenue — a relevant signal for screens that prioritize stability over high but volatile growth.
Predefined Ranges
- Low (< 0.3)
- Moderate (0.3 to 0.7)
- High (> 0.7)
9. Beta
Beta measures the sensitivity of an asset’s price movements relative to the broader market. A beta above 1.0 indicates higher volatility than the market; a beta below 1.0 indicates lower volatility. A negative beta indicates that an asset tends to move inversely to the market.
Predefined Ranges
- Inverse (< 0)
- Low (0 to 0.5)
- Moderate (0.5 to 1)
- High (1 to 1.5)
- Very High (> 1.5)
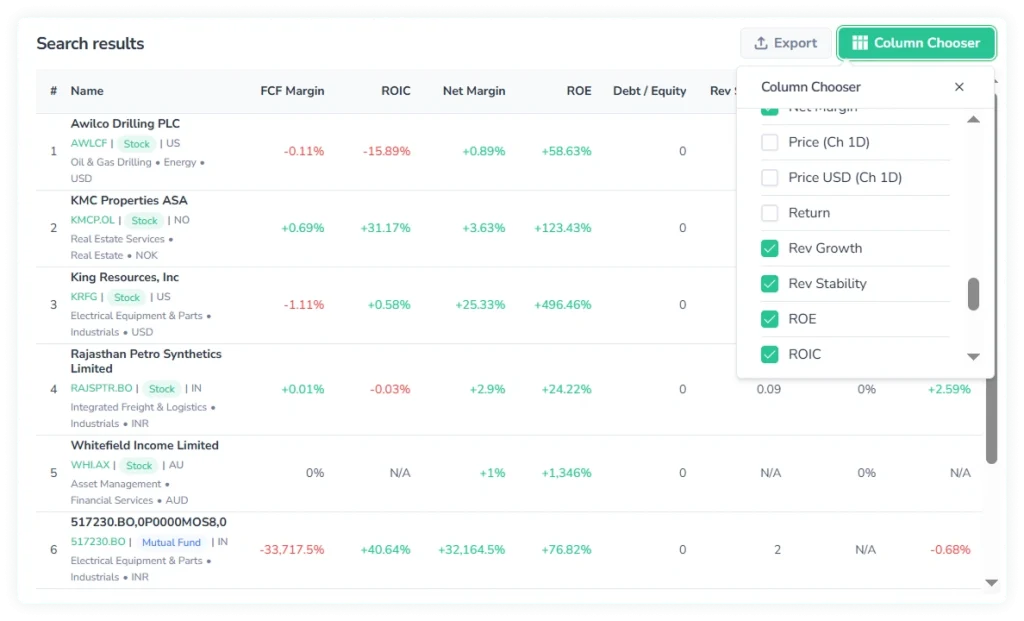
Results Table
Each of the nine metrics can also be displayed as a column in the results table. To add them, open the column chooser and check the relevant fields.
Practical Value
The added filters cover the metrics most commonly used to assess business quality — profitability, capital efficiency, growth trajectory, leverage, and market sensitivity. They enable evaluating a company’s financial substance directly from the search view.
Consider a screen that starts with a quote type — stock, a defined market cap range, and a specific sector. That returns a broad list of candidates. Adding a high Net Margin filter immediately narrows the list to companies with strong profitability. Layering a high ROIC threshold on top shifts the results further, to businesses that are not only profitable but generating strong value on the capital they deploy.
A different starting point: filtering for fast revenue growth returns high-growth companies across a given market. Adding a high Revenue Stability threshold to that screen excludes companies with inconsistent growth. What remains are businesses that have expanded consistently — a result that growth rate alone would not produce.
Bottom Line
The added filters extend the search beyond market classification and price-based criteria. In practice, this means a screen that previously required cross-referencing multiple ticker pages can now be built and evaluated entirely within the search.