
New Fields in the Search Endpoint
Explore 9 new fields added to the search endpoint. Retrieve profitability, capital efficiency, growth, and risk in one API call.
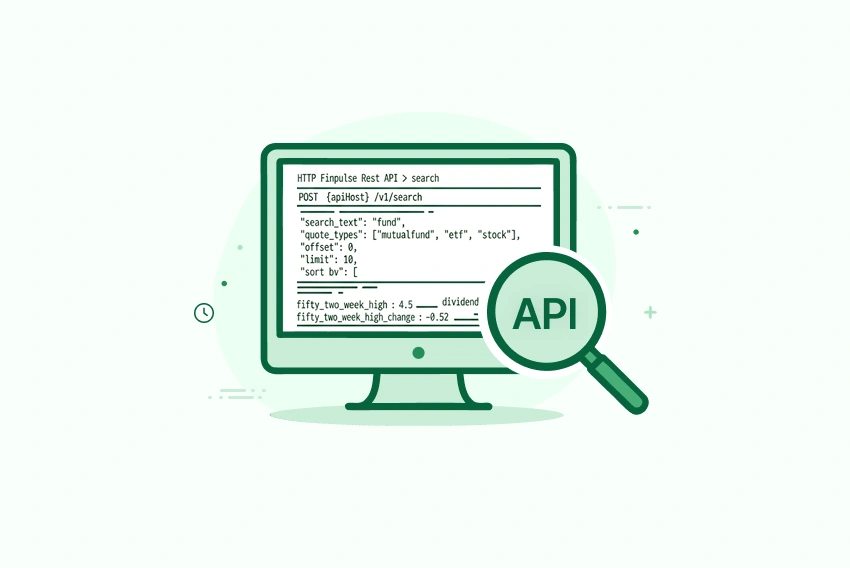
Screening for quality equities typically requires signals from multiple data categories — profitability, capital efficiency, growth trajectory, leverage, and market risk. Until now, retrieving these signals via the FinImpulse API required combining search results with additional calls to fundamentals endpoints. Results then had to be assembled on the client side.
The search endpoint has accordingly been updated to return 9 more pre-computed fields that cover all these dimensions in a single response, reducing round-trips for standard screening workflows.
New Fields in the Search Endpoint
The added fields span profitability, capital efficiency, growth, and risk metrics. The table below lists each field name and its description.
| Field name | Description |
|---|---|
| free_cash_flow_margin | Free cash flow margin (FCF Margin). |
| return_on_invested_capital | Return on Invested Capital (ROIC). |
| net_margin | Net Margin. |
| return_on_equity | Return on Equity (ROE). |
| debt_to_equity | Debt-to-Equity (D/E). |
| revenue_stability | Revenue Stability (Volatility). |
| revenue_growth | Revenue Growth (3Y/5Y CAGR). |
| eps_growth | EPS Growth (3Y/5Y CAGR). |
| beta | Beta. |
Free Cash Flow Margin
FCF Margin measures the share of revenue that is converted into actual cash after capital expenditures are deducted. Unlike net income, it is not affected by non-cash items or accrual accounting adjustments, which makes it a more direct indicator of a company’s ability to generate distributable cash.
Formula: FCF Margin = Free Cash Flow / Revenue,
where Free Cash Flow = Operating Cash Flow – CapEx.
Typical filter values: FCF Margin > 0.10, FCF Margin > 0.15.
Return on Invested Capital (ROIC)
ROIC measures how efficiently a company generates operating profit relative to the total capital deployed — both debt and equity. It is widely considered one of the most reliable indicators of business quality, as it directly reflects whether a company generates value above its cost of capital.
Formula: ROIC = NOPAT / Invested Capital,
where NOPAT = Operating Income × (1 – Tax Rate).
Typical filter values: ROIC > 0.15, ROIC > 0.20.
Net Margin
Net Margin expresses net income as a percentage of revenue, reflecting the profit remaining after all operating costs, interest, and taxes have been accounted for. It is a standard measure of bottom-line efficiency.
Formula: Net Margin = Net Income / Revenue.
Typical filter values: Net Margin > 0.15, Net Margin > industry median.
Return on Equity (ROE)
ROE measures how effectively a company generates profit from shareholders’ equity. High ROE can reflect genuine operational efficiency, but it can also result from elevated financial leverage — which is why ROE is typically read alongside Debt/Equity.
Formula: ROE = Net Income / Shareholder Equity.
Typical filter values: ROE > 0.15, ROE > 0.20.
Debt to Equity
Debt/Equity quantifies a company’s financial leverage by comparing total debt to shareholder equity. It indicates the degree to which operations and assets are financed through borrowing versus equity capital. Higher values correspond to greater balance sheet risk, particularly in rising-rate environments.
Formula: Debt / Equity = Total Debt / Total Equity.
Typical filter values: Debt/Equity < 1.0, Debt/Equity < 0.5.
Revenue Stability
Revenue Stability captures how consistent a company’s top-line growth has been over time. It is calculated as the standard deviation of annual revenue growth rates over the past five years. Lower values indicate smoother, more predictable growth — a characteristic that matters for long-term analysis and for models that rely on stable cash flow projections.
Formula: Revenue Volatility = stddev(annual revenue growth rates, last 5 years).
Typical filter values: Revenue growth volatility < 0.20.
Revenue Growth
Revenue Growth measures the compound annual growth rate of a company’s total revenue over a defined lookback period, typically 3 or 5 years. It is the primary indicator of whether a business is expanding its top line at a meaningful pace.
Formula: Revenue CAGR = (Revenue_t / Revenue_t-n)^(1/n) – 1.
Typical filter values: Revenue CAGR 3Y > 0.15, Revenue CAGR 5Y > 0.10.
EPS Growth
EPS Growth measures the compound annual growth rate of earnings per share. While revenue growth reflects top-line expansion, EPS growth captures whether that expansion is translating into per-share profitability — accounting for dilution, cost management, and financial leverage effects.
Formula: EPS CAGR = (EPS_t / EPS_t-n)^(1/n) – 1.
Typical filter values: EPS CAGR 5Y > 0.12, EPS growth next year > 0.10.
Beta
Beta measures the sensitivity of an asset’s price movements relative to the broader market. A beta of 1.0 implies price movements align with the market. Values above 1.0 indicate higher volatility; values below 1.0 indicate lower sensitivity to market swings. Negative beta is possible for assets that tend to move inversely to the market.
In screening workflows, it is most useful as a risk filter: either to target low-volatility assets or to set an upper bound on market sensitivity.
Typical filter values: beta < 1.0, beta < 1.2.
Implementation Example
The added fields can be useful for structured screening workflows that evaluate multiple conditions in a single request. As an example implementation, the AI Search feature in the FinImpulse dashboard maps natural language queries to filter conditions against the search endpoint.
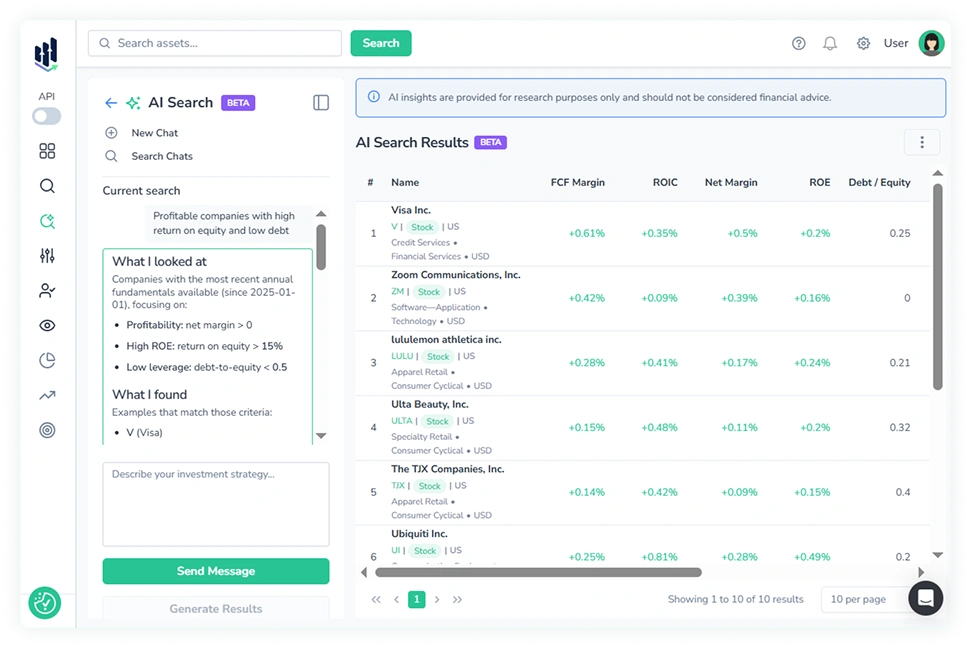
A query such as “profitable companies with stable revenue and low debt” is resolved by mapping the input to a set of concrete field conditions, without fetching fundamentals separately:
- net_margin > 0.15
- return_on_invested_capital > 0.15
- revenue_stability < 0.20
- debt_to_equity < 1.0
All four conditions are evaluated within a single request.
One more example — “high-growth companies with strong cash flow and moderate market risk” maps to a combination of revenue_growth, eps_growth, free_cash_flow_margin, and beta — again resolved in a single pass against the search endpoint.
The Bottom Line
With these 9 new fields in the search endpoint, it is now possible to retrieve profitability, capital efficiency, growth, leverage, and market risk data in a single request.
This reduces the integration complexity for screening tools, data pipelines, and AI-powered query engines that evaluate multiple conditions simultaneously.
New accounts receive a $1 API credit upon registration.