The Historical tab provides interactive charts and a detailed historical table. It is consistent across all ticker types (Stocks, ETFs, and Mutual Funds) and contains two main sections:
1. Interactive Historical Chart
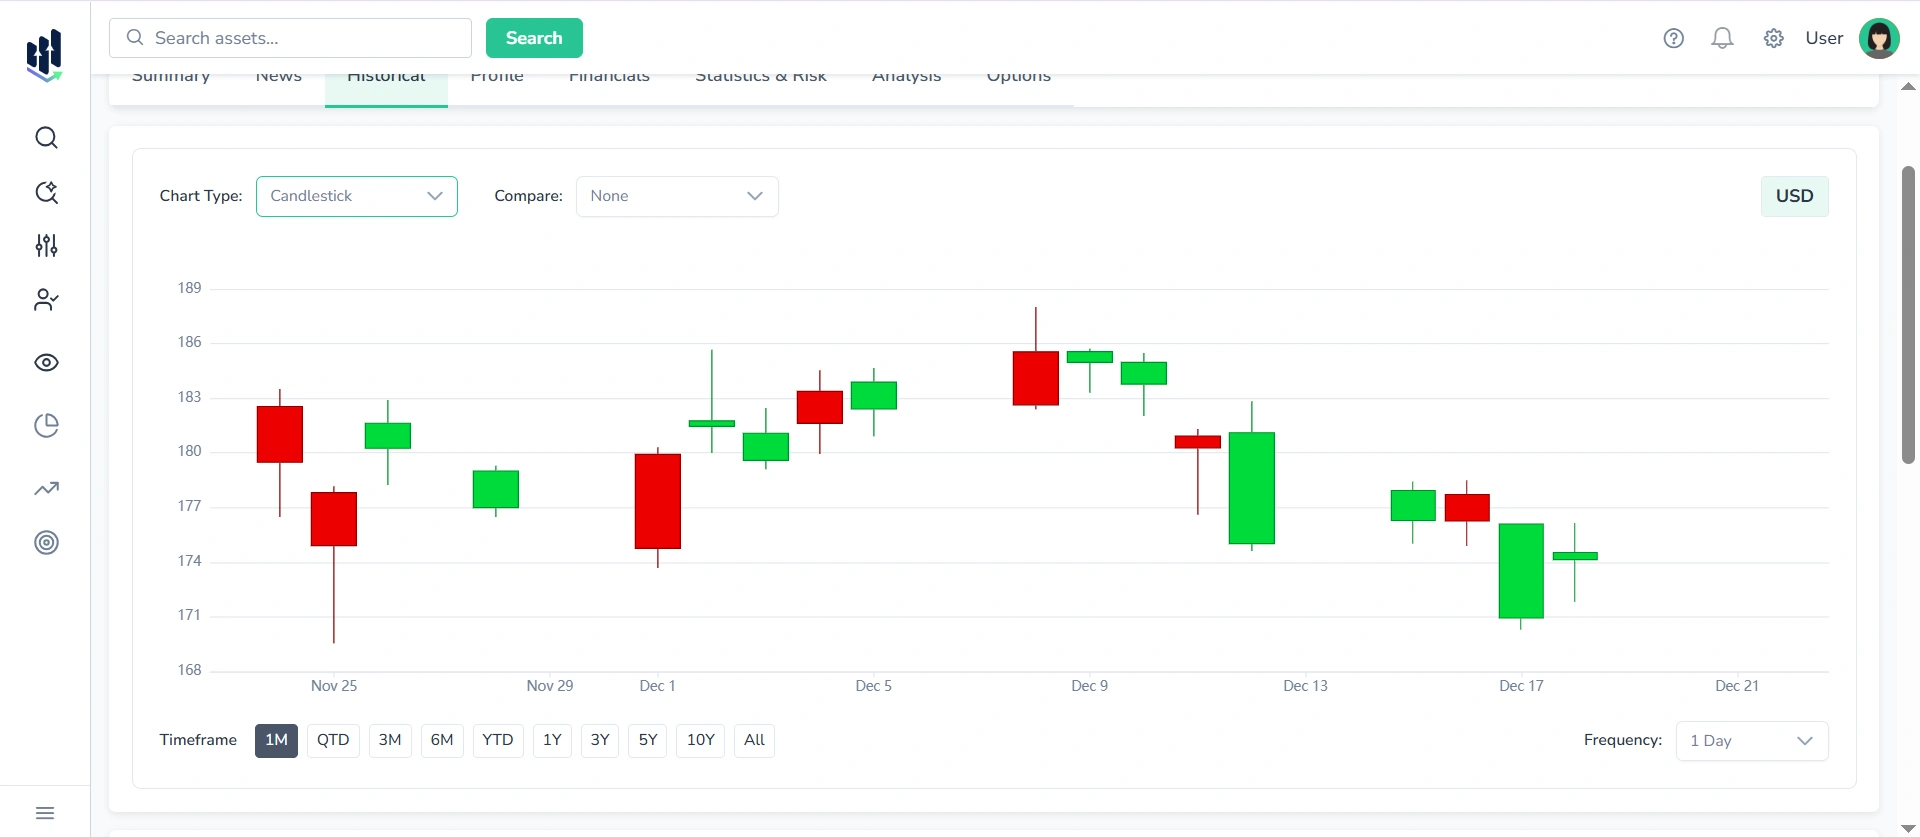
The interactive price chart, which allows you to:
- Choose the Chart type: Сandlestick, Line, Mountain
- Compare with benchmarks: S&P 500, NASDAQ, DOW
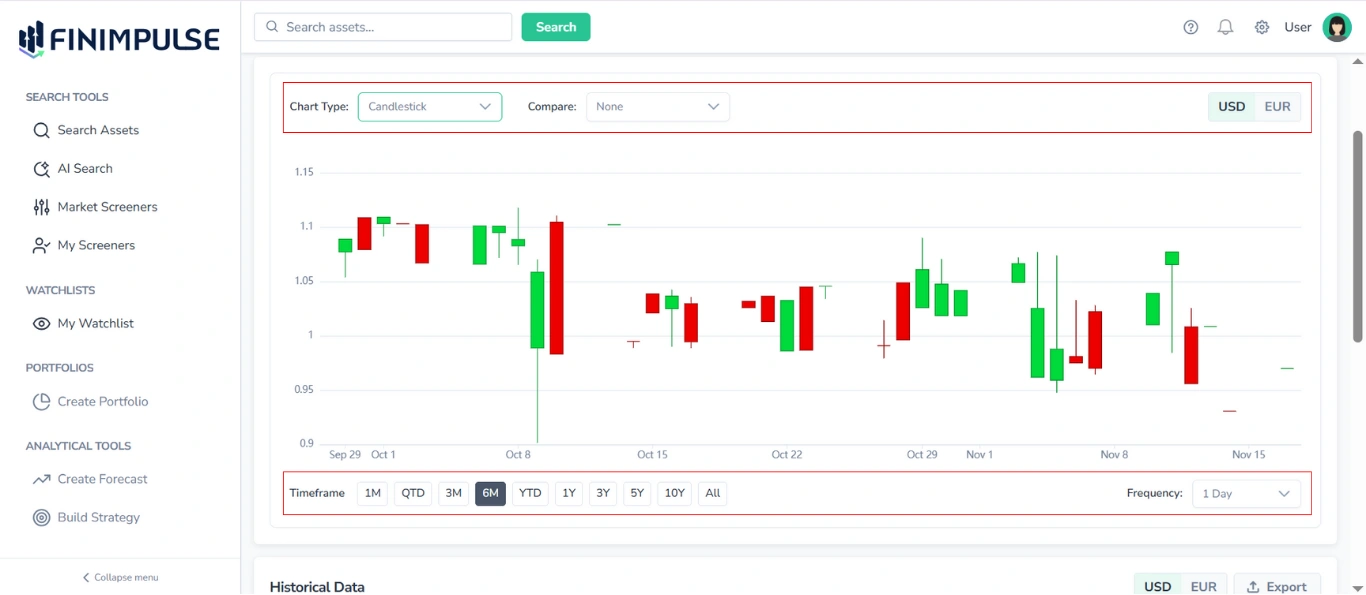
- Choose display currency: Many global assets trade in local currencies (e.g., HKD, GBP, JPY, VND). So if the ticker supports dual pricing, FinImpulse provides a currency toggle feature that lets you view the price chart in both currencies:
- Local currency price (the original trading currency)
- USD-normalized price (converted using live FX rates)
- Adjust timeframes: Select from preset intervals, including 5D, MTD, 1M, QTD, 3M, 6M, YTD, 1Y, 3Y, 5Y, 10Y, and All.
- Set data frequency: Choose how often data points appear on the chart (1d, 1w, 1m, 3m).
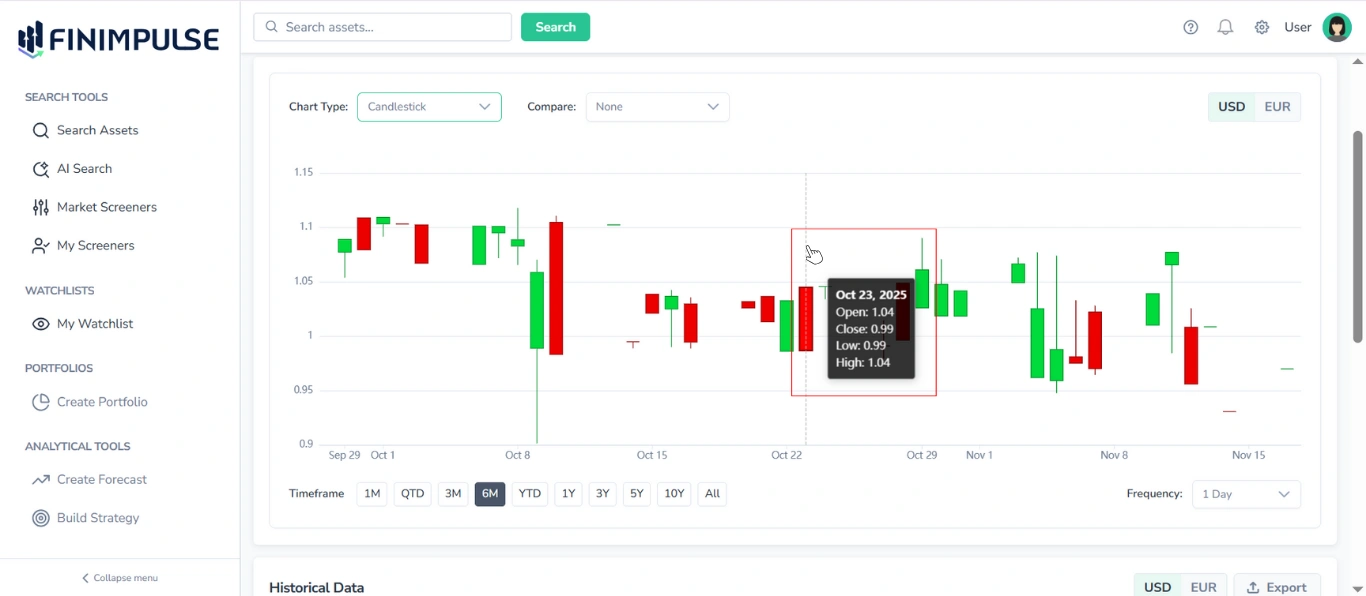
- Hover over the chart: Displays a vertical marker and a detailed legend with Open, Close, High, Low values, and the Date for the selected point in time. If dual pricing is supported, all displayed metrics, tooltips, and chart lines will be updated to reflect the selected currency.
- Scroll to zoom: Use your mouse wheel or trackpad to zoom in and out of the chart.
- Click and drag horizontally: Scroll through the historical data range on the chart.
2. Historical Data Table
Located below the chart, the historical table provides a detailed breakdown of historical records.
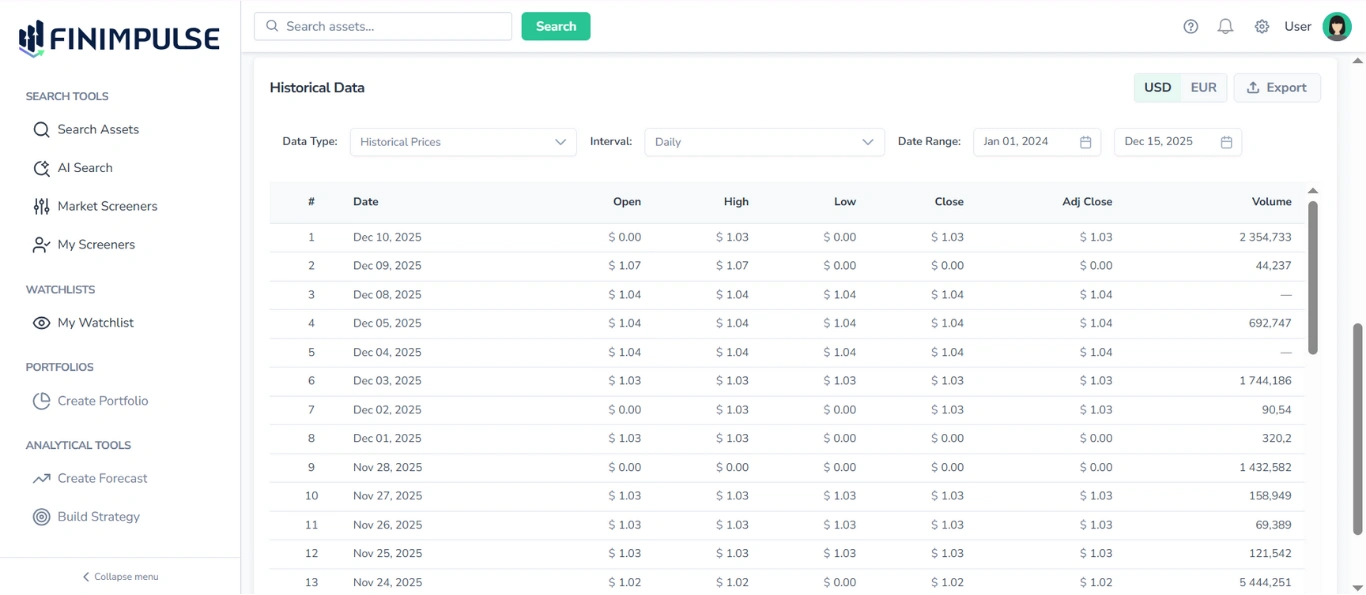
You can filter by:
- Data Type: Historical Prices, Dividends, Splits, Capital Gains
- Interval: Daily, Weekly, Monthly
- Date Range
- Currency toggle (USD or local)
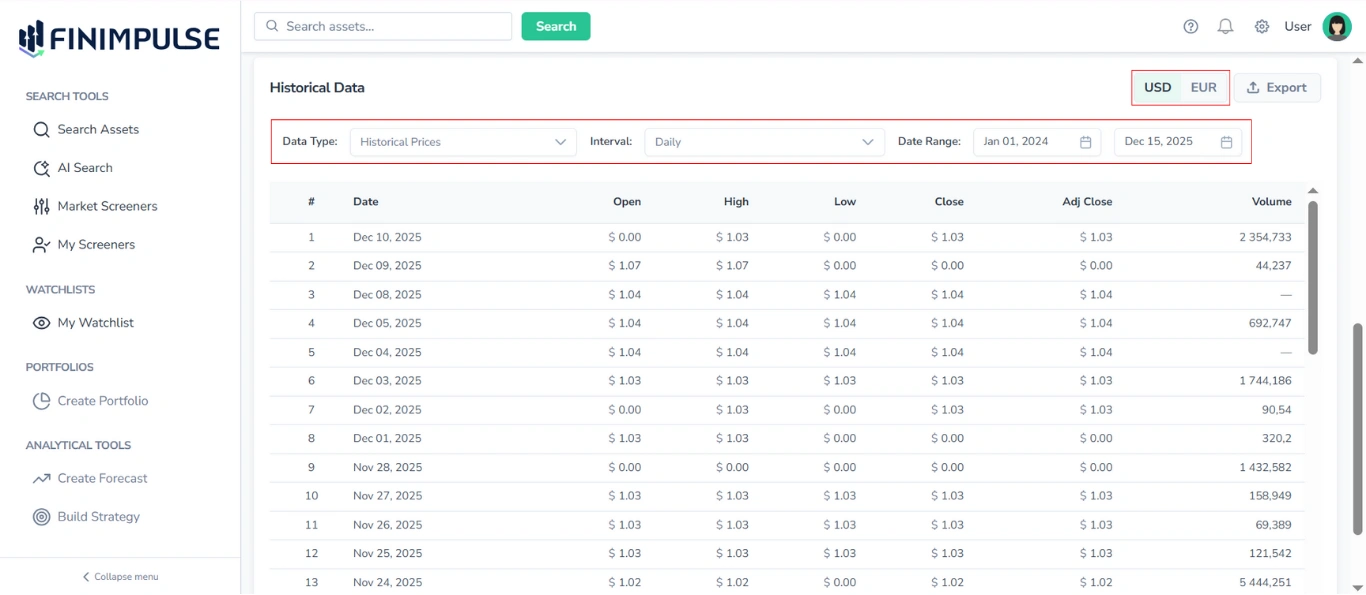
Each row shows:
- Date
- Open / High / Low / Close
- Adjusted Close
- Volume (not available for Mutual Funds)
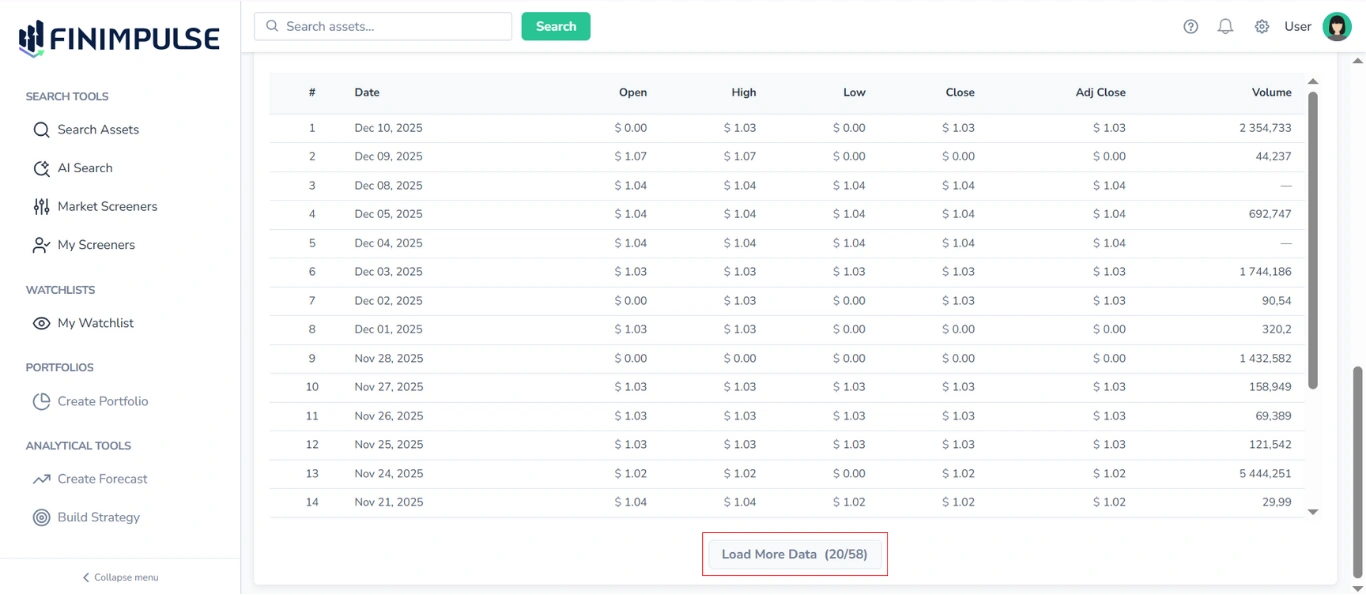
Click the Load More Data button to see more rows as you scroll.
3. Export
The Export feature allows you to download the historical table in various formats.
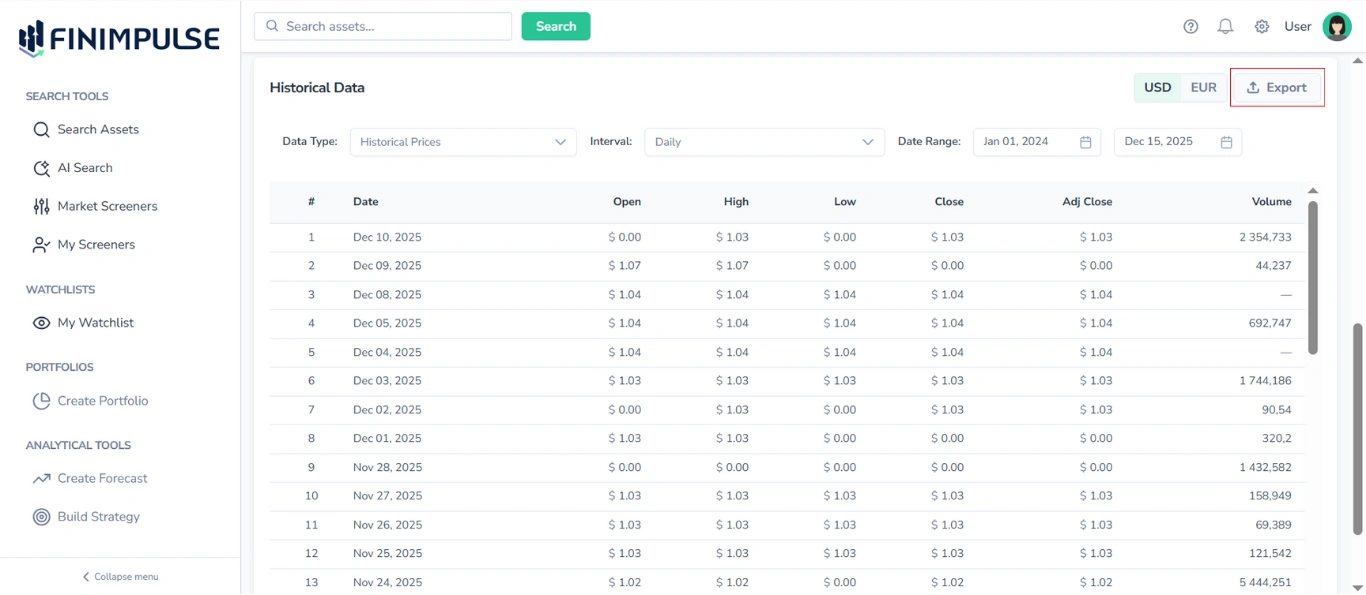
Supported formats:
- CSV (.csv)
- JSON (.json)
- Excel (.xlsx)
See the Export Guide for detailed instructions on exporting data.
For access to complete datasets or advanced data needs, use API Mode.