
Market Screeners are pre-configured collections of filters designed to highlight specific market conditions or standard trading setups.
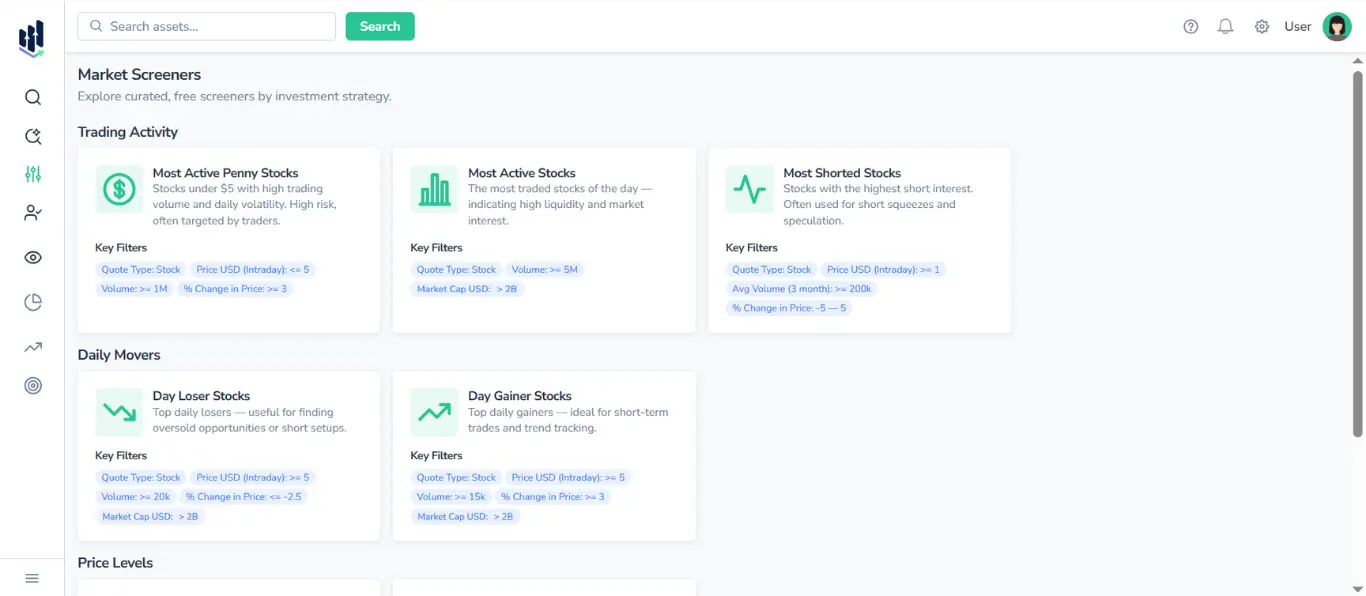
These are designed for quick exploration, allowing users to instantly view lists such as the most active stocks, daily losers, new 52-week highs, and more.
Each screener displays:
- Title
- Short strategy description
- List of key filters applied behind the scenes
When you click on a screener, FinImpulse opens the Search Assets page with all filters applied automatically. You can extend, refine, sort, and export the results just as in a regular search.
For more details, see the Assets Search & Filtering Guide.
1. Types of Market Screeners
Below is a detailed description of each screener visible in the interface.
1.1. Trading Activity
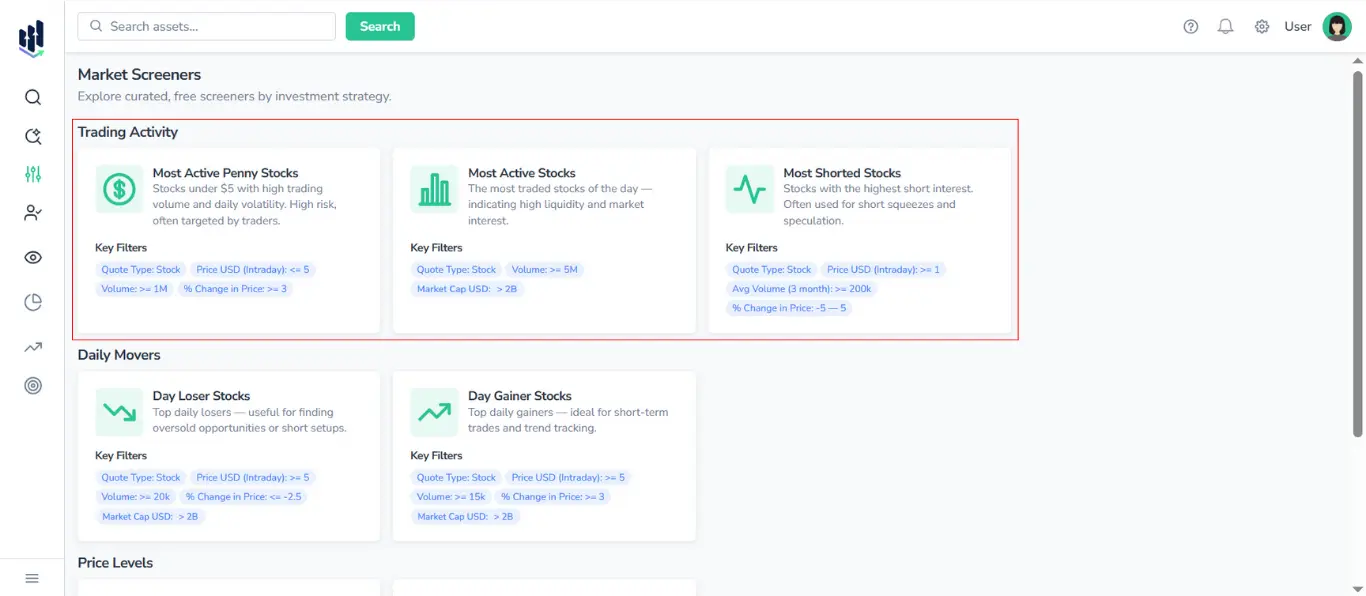
1.1.1. Most Active Penny Stocks
Stocks priced under $5 that currently show unusually high trading volume or trade activity. These stocks typically exhibit elevated volatility and higher risk, often attracting retail traders, day traders, and investors employing speculative trading strategies.
Key Filters:
- Quote Type: Stock
- Price USD (Intraday): ≤ 5
- Volume: ≥ 1M
- % Change in Price: ≥ 3
1.1.2. Most Shorted Stocks
Stocks with the highest levels of short interest. These securities are often associated with increased volatility, potential short squeeze conditions, and speculative trading behavior.
Key Filters:
- Quote Type: Stock
- Price USD (Intraday): ≥ 1
- Avg Volume (3M): ≥ 200k
- % Change in Price: between -5 and +5
1.1.3. Most Active Stocks
The most heavily traded stocks of the day — strong indicators of liquidity, institutional attention, or significant market news.
Key Filters:
- Quote Type: Stock
- Volume: ≥ 5M
- Market Cap USD: > 2B
Note: FinImpulse always uses USD-normalized market caps.
1.2. Daily Movers
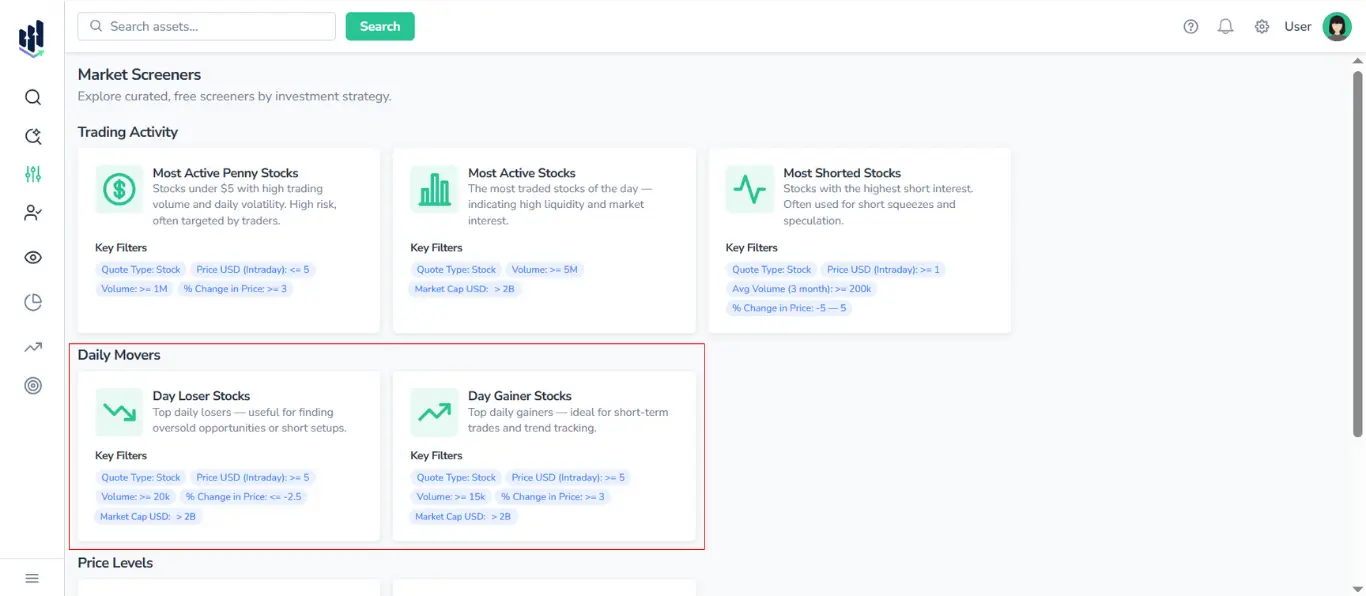
1.2.1. Day Loser Stocks
Stocks are experiencing the largest percentage declines during the current trading session. Used to identify oversold levels, potential dip-buying zones, or early signs of trend reversals.
Key Filters:
- Quote Type: Stock
- Price USD (Intraday): ≥ 5
- Volume: ≥ 20k
- % Change in Price: ≤ -2.5
- Market Cap USD: > 2B
1.2.2. Day Gainer Stocks
Stocks exhibiting the highest percentage increases during the current trading session, typically monitored to assess momentum strength, emerging trend development, and shifts in market sentiment.
Key Filters:
- Quote Type: Stock
- Price USD (Intraday): ≥ 5
- Volume: ≥ 15k
- % Change in Price: ≥ 3
- Market Cap USD: > 2B
1.3. Price Levels
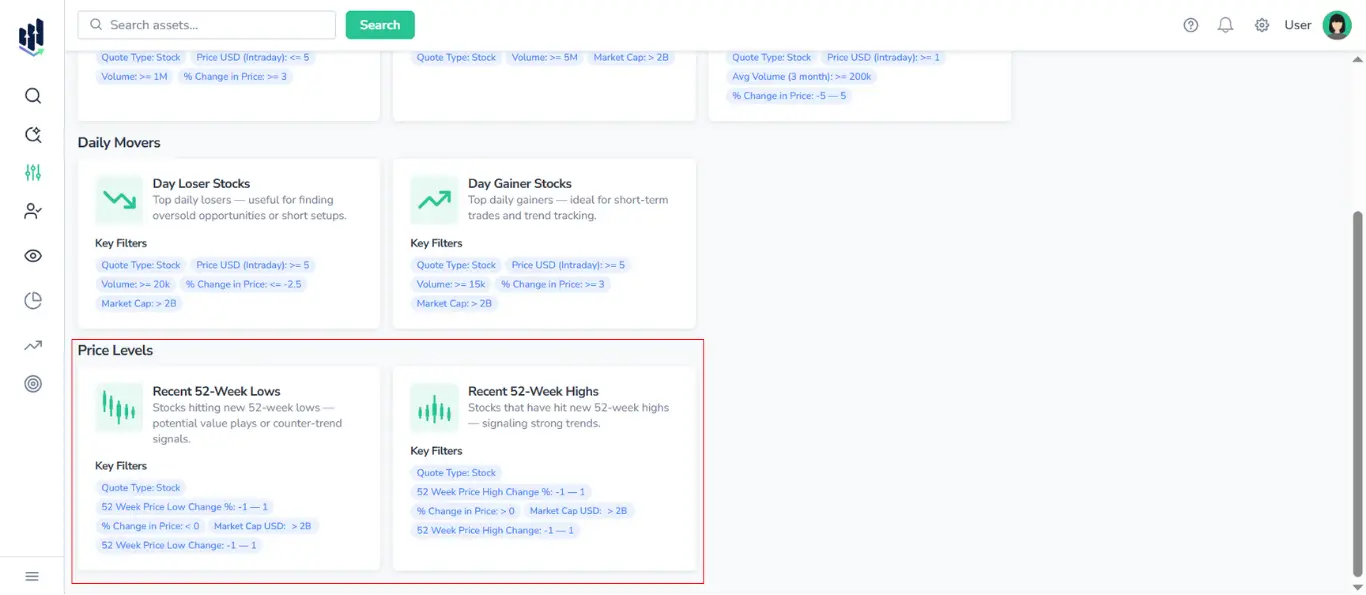
1.3.1. Recent 52-Week Highs
Stocks that have reached a new 52-week high — often analyzed in the context of price momentum, trend strength, and shifts in market sentiment or fundamental performance.
Key Filters:
- Quote Type: Stock
- 52-Week Price High Change (% and abs): between -1 and +1
- % Change in Price: > 0
- Market Cap USD: > 2B
1.3.2. Recent 52-Week Lows
Stocks that have recently reached a new 52-week low — often examined for indications of sustained downward pressure, potential valuation dislocations, or shifts in market sentiment.
Key Filters:
- Quote Type: Stock
- 52-Week Price Low Change (% and abs): between –1 and +1
- % Change in Price: < 0
- Market Cap USD: > 2B
2. Export
Just like results from regular search, the results from screeners can be exported to:
- CSV (.csv)
- JSON (.json)
- Excel (.xlsx)
For more detailed instructions, see the Export Manual.