
The FinImpulse results table is a dynamic tool that displays assets matching your search criteria and filters. This guide explains how to interpret each column, customize data fields, sort and multi-sort results, and export your findings for further analysis.
1. Search Results Table
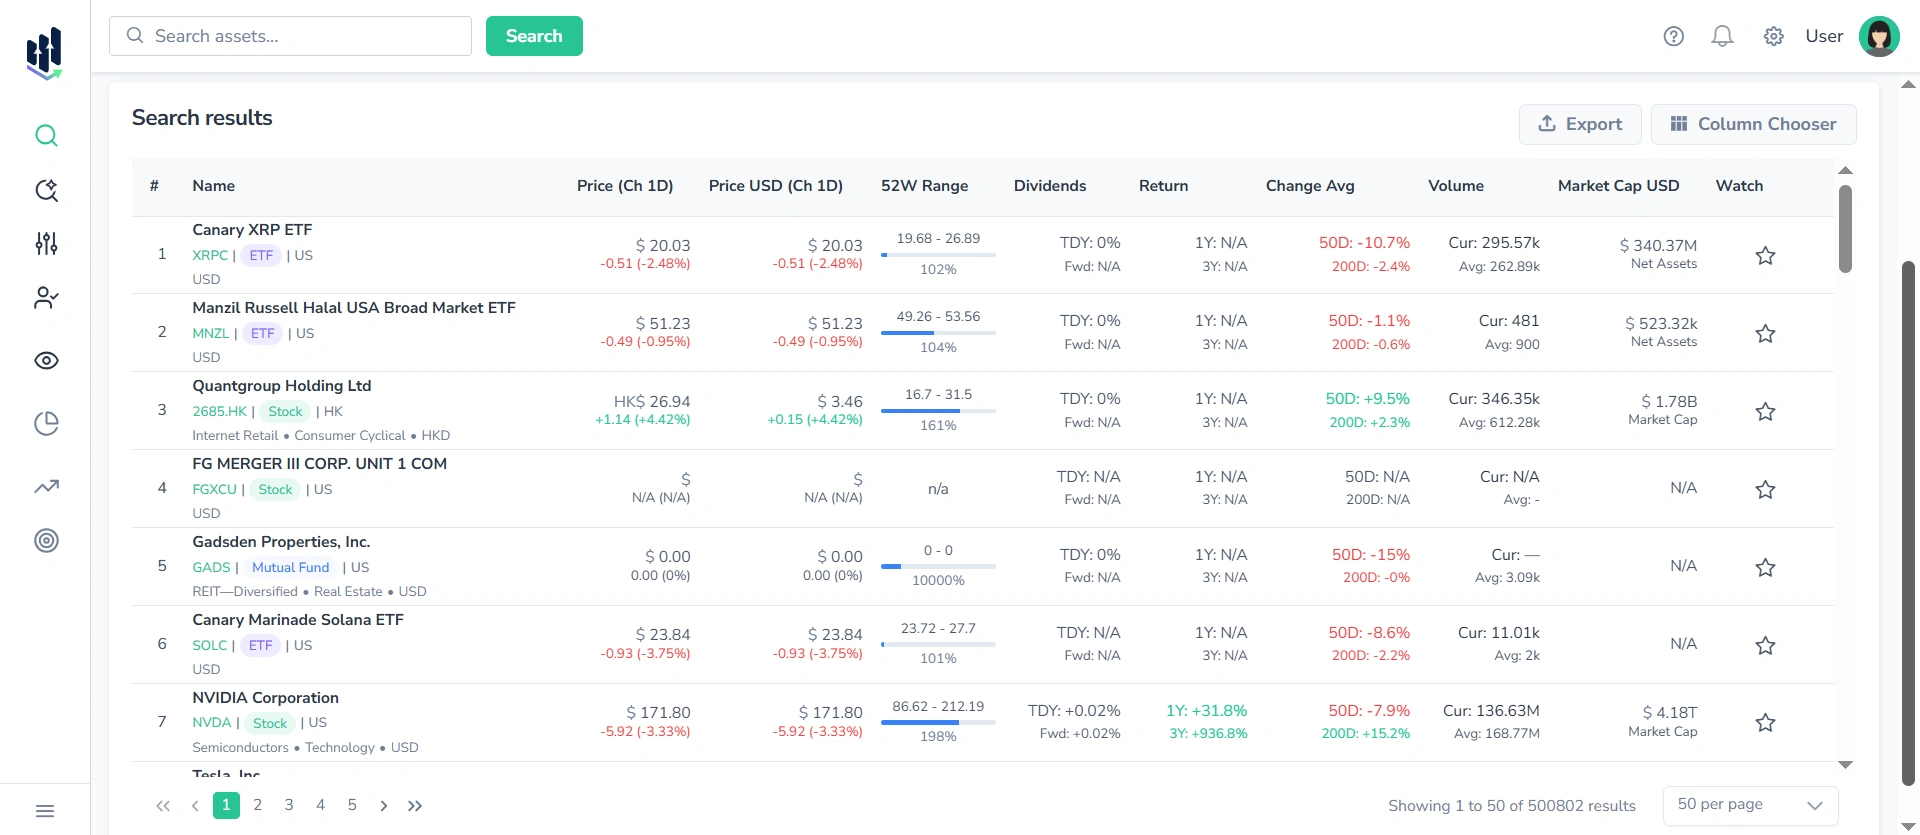
The results table dynamically updates based on active filters, sorting rules, and selected columns. Each row in the table represents a single asset. Columns display information, including identification data, pricing, performance metrics, 52-week range, dividends, returns, market cap, volume, and watchlist status.
Note: If a particular data field is not applicable, it appears as “—” or N/A.
1.1. Key behaviours
There are some interactions and expected behaviors when working with the Search results table:
1.1.1. Color Coding
Some values in the table are color-coded:
- Green indicates a positive value or upward movement
- Red indicates a negative value or downward movement
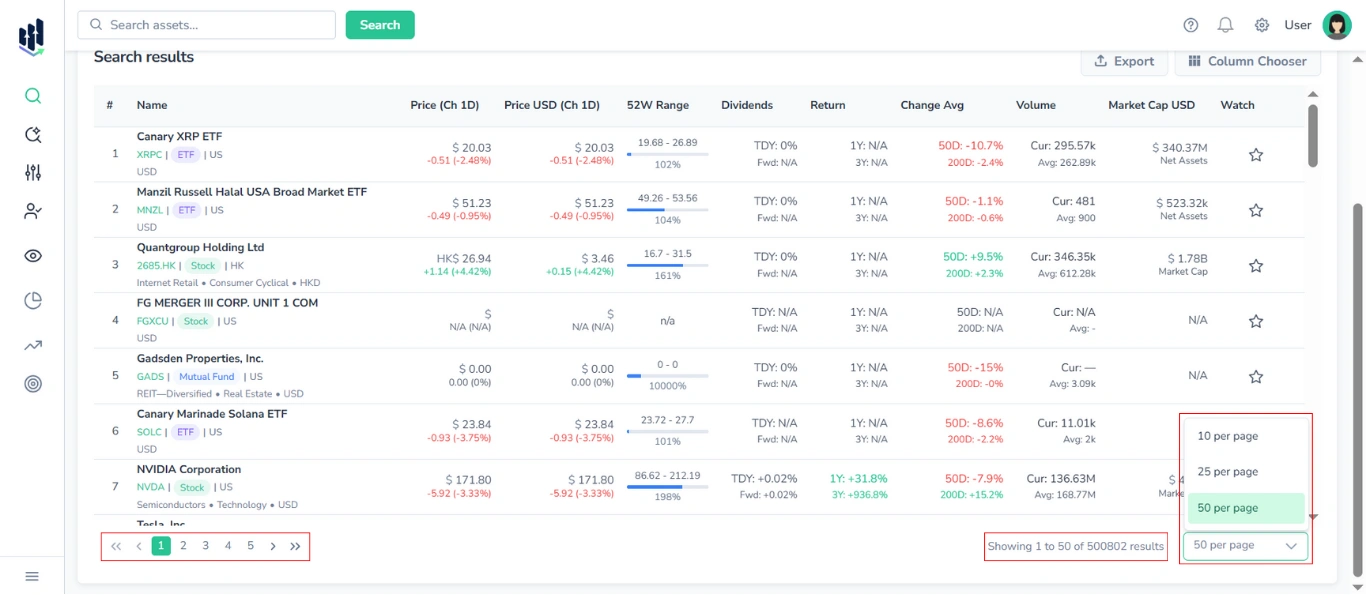
1.1.2. Table View and Pagination
The table is scrollable and supports pagination.
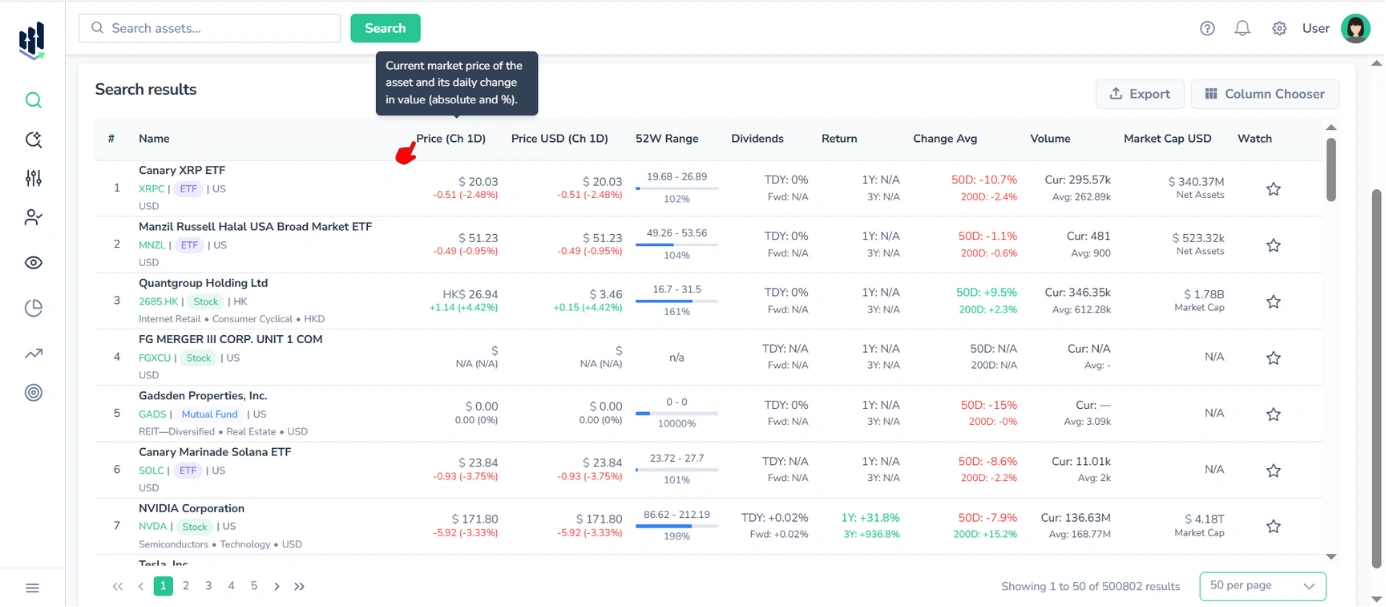
1.1.3. Column Header Tooltips
Hovering over any column header displays a tooltip with a brief explanation of the column’s content.
1.1.4. Adding Assets to My Watchlist
You can save assets to your Watchlist directly from the table by clicking the star icon in the “Watch” column.
For step-by-step instructions, see the My Watchlist Manual.
1.2. Detailed Asset Information
Each row in the Search results table represents a separate asset. Clicking on any row will open a page with detailed information about that asset.
This way, you can access the Summary, Financials, Statistics, and other tabs directly.
For more information, see the Detailed Ticker Information Guide.
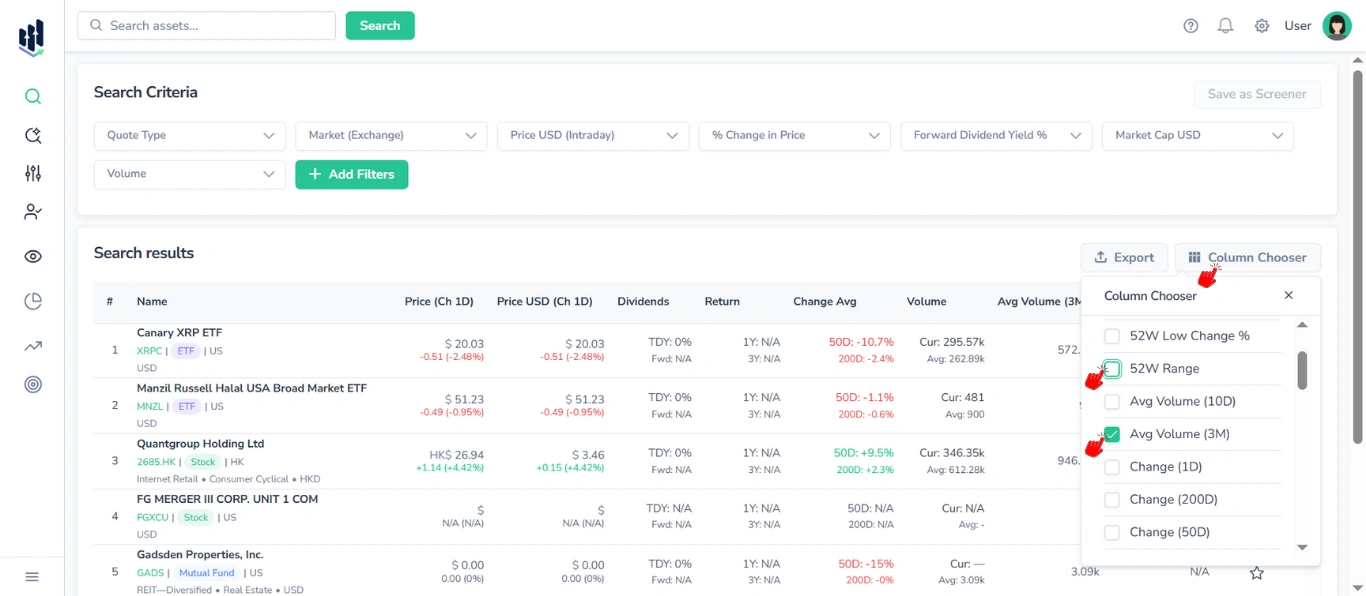
1.3. Column Chooser
The Column Chooser menu provides full control over which data points are displayed in the results table.
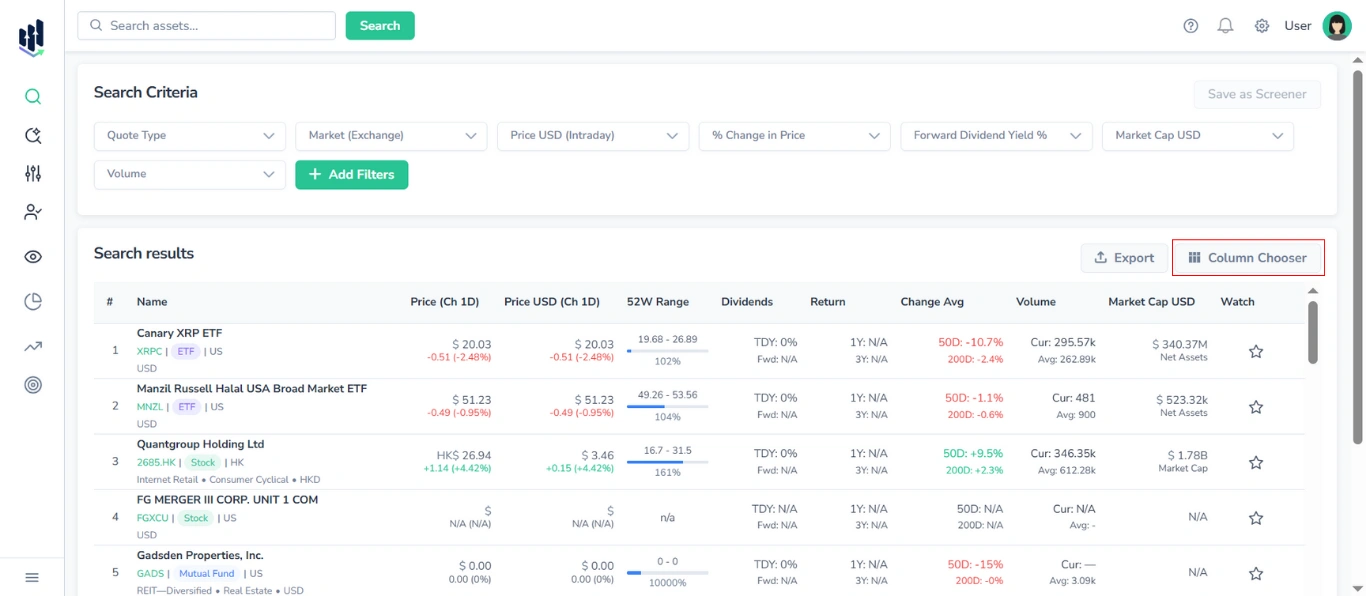
You can:
- Enable or disable any column
- Add or remove all available metric categories (35+)
Note: The table updates automatically, your configuration saves for the current session.
Example workflow:
- Open Column Chooser
- Enable “Avg Volume (3M)”
- Disable “52W Range”
1.4. Sorting the Table
The search results table supports single-column sorting and multi-column sorting.
1.4.1. Single Sorting
Click on any column header:
- First click: Sort ascending (triangle up)
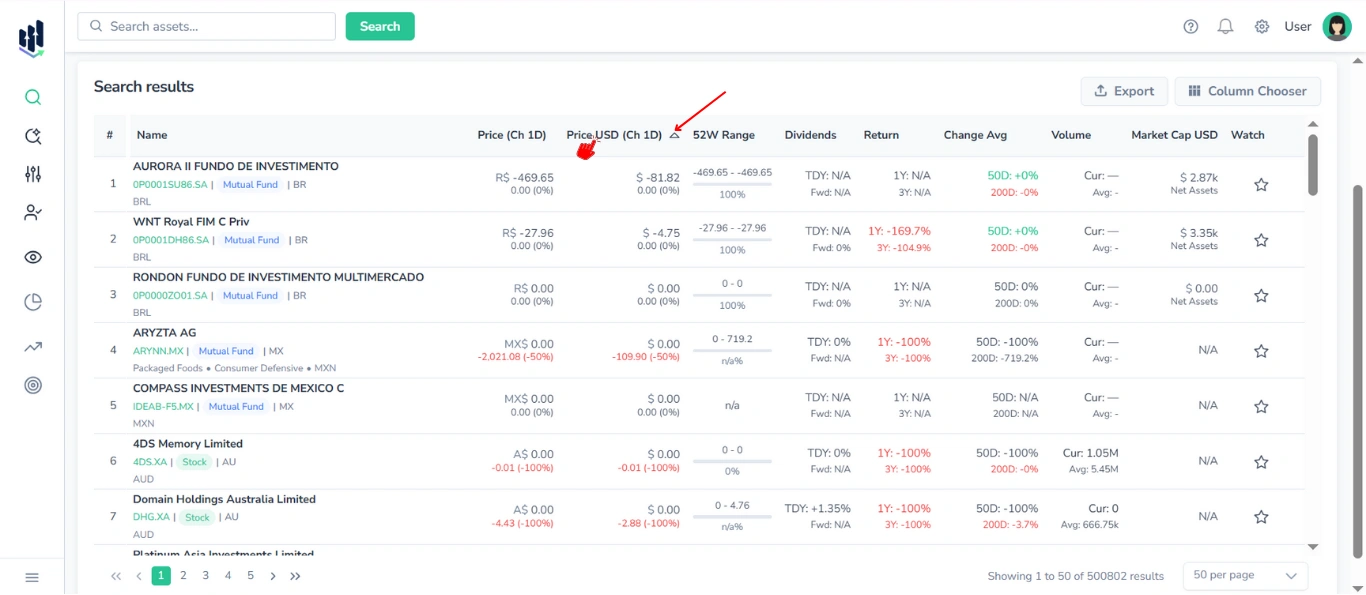
- Second click: Sort descending (triangle down)
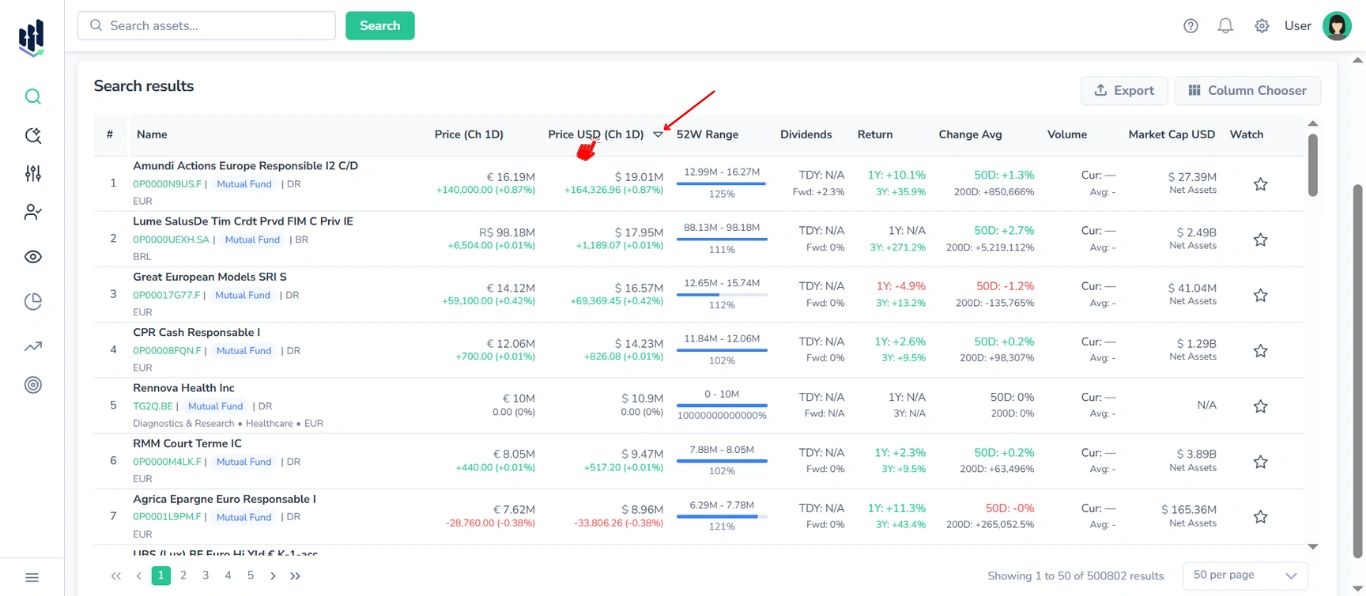
- Third click: Reset sorting (no triangle)
1.4.2. Multi-Sorting
You can apply sorting to multiple columns simultaneously. Sorting is applied in the order you select the columns.
For example, you can sort by Price (ascending) and then by Market Cap (descending) to view assets with the lowest price and the highest market cap at the top. This works similarly to Excel or SQL ORDER BY chains.
1.5. Exporting Results
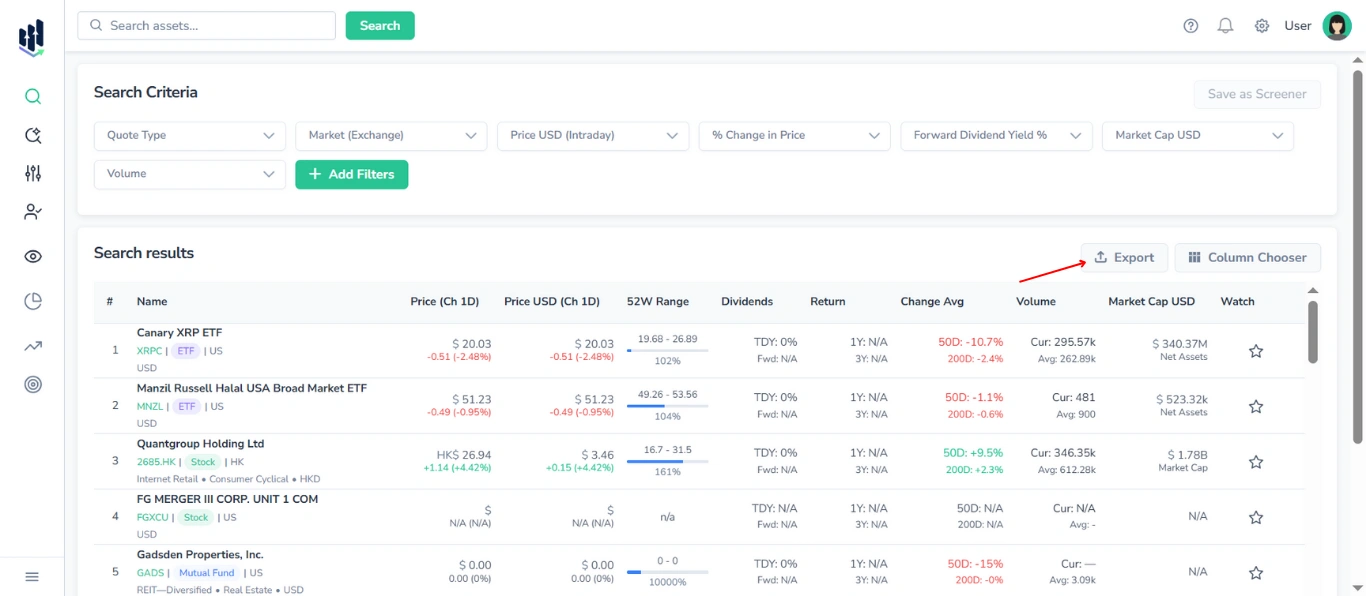
You can export the filtered and customized table in:
- CSV (.csv)
- JSON (.json)
- Excel (.xlsx)
For more detailed instructions, see the Export Manual.
2. Empty Search Results
If no results are found for your search, an empty table with a ‘No results’ message will be displayed.
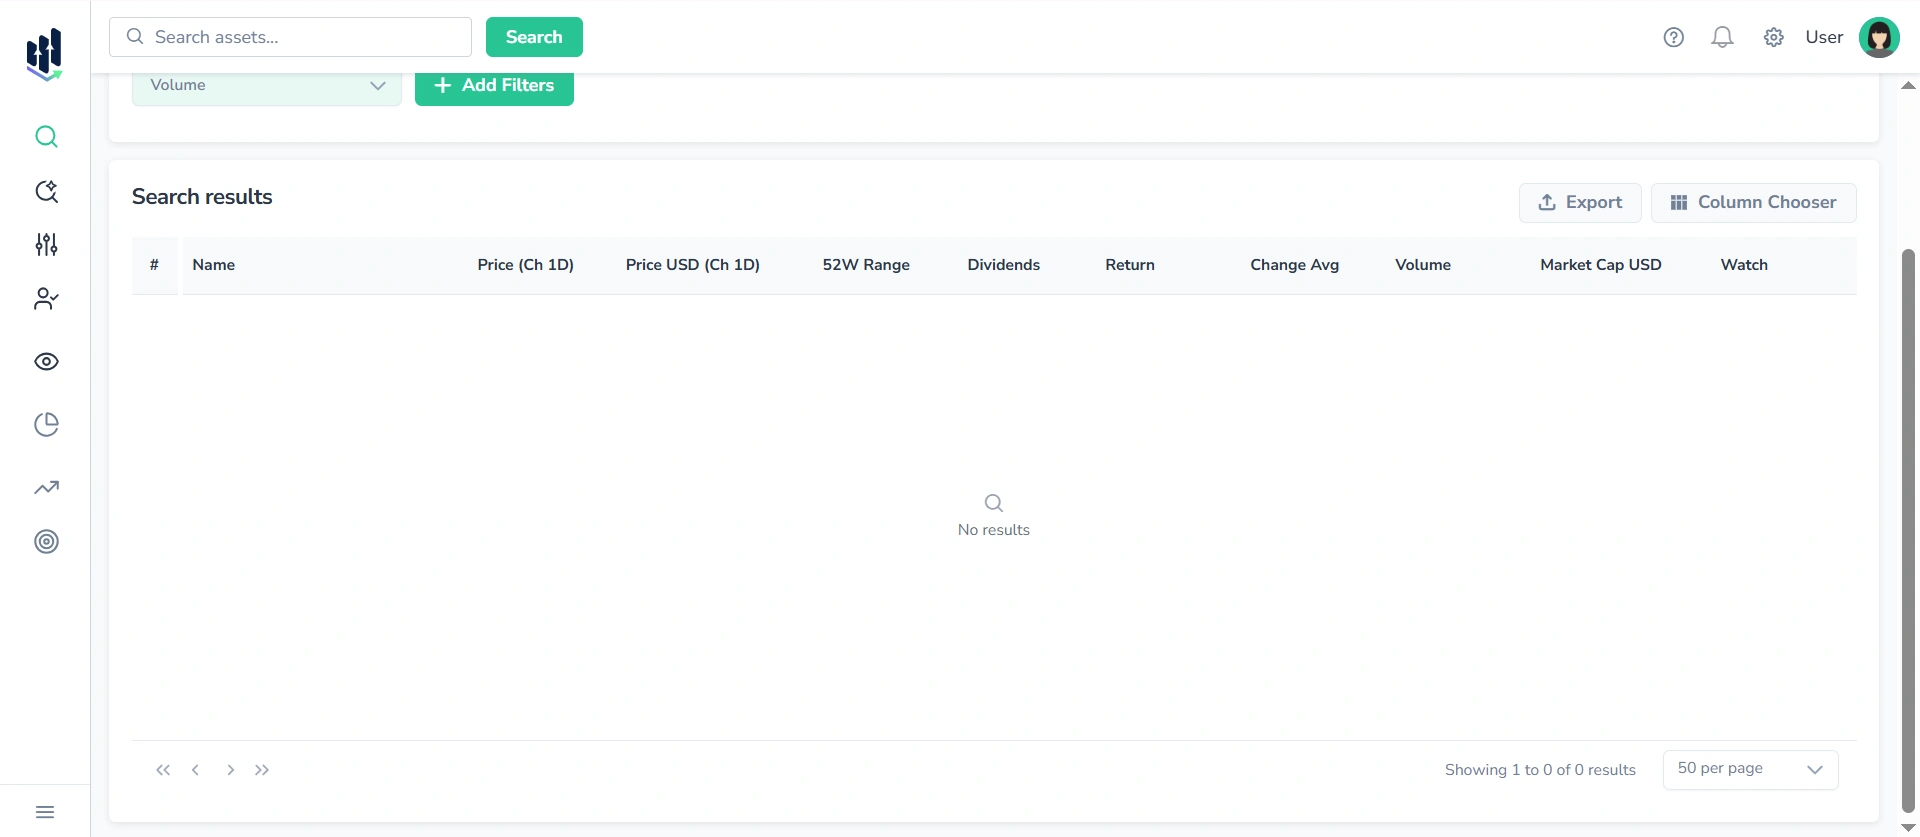
Tip: Try adjusting your filters, refining your search query, or reviewing this manual one more time to ensure you are using the features correctly.