
Contains comprehensive financial statements. This tab content is primarily available for Stocks, but some Funds also provide financials. The layout and content of the Financials tab are consistent across all asset types.
Note: All data presented in the Financials tab is based on the most recent publicly available filings.
There is also a Valuation Measures table, which is a standardized summary of key financial metrics. While this table refers to Financials, it is actually located in the Statistics & Risk tab.
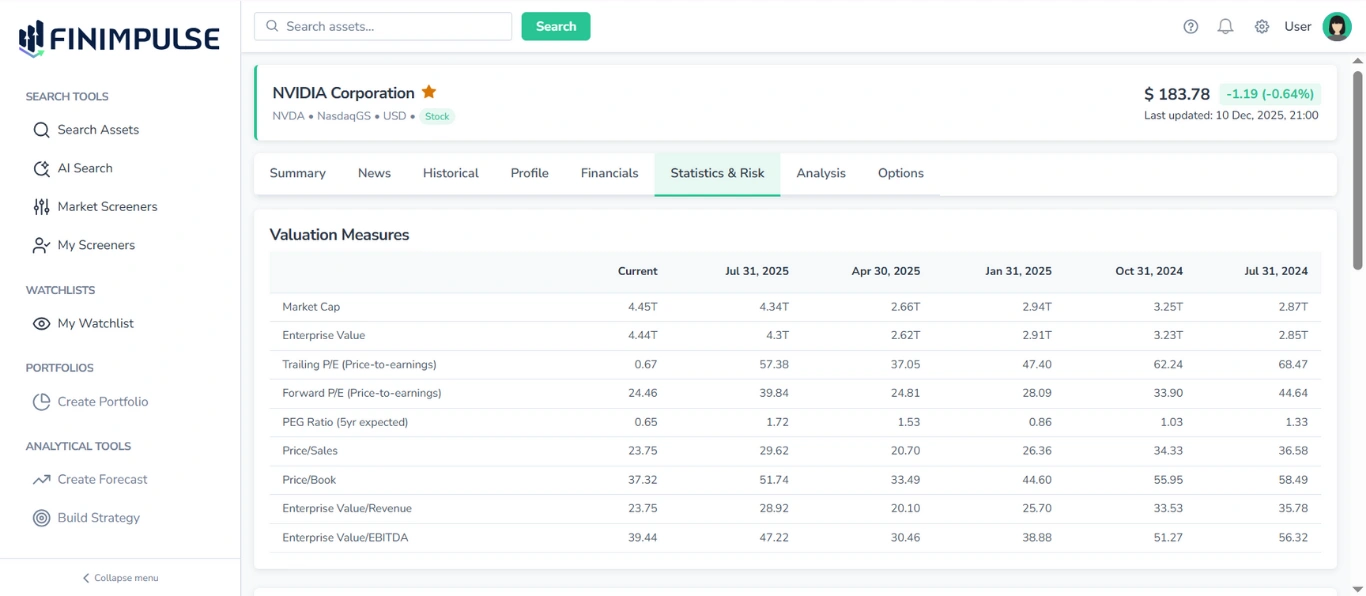
For a complete financial overview, refer to both the Financials tab and the Statistics & Risk tab🡽.
Note: A dedicated Financials filter — Public Financial Reports — is available on the Search Assets page, allowing you to search specifically for assets that have (or do not have) financial statements.
For more details on search, see the Global Asset Search & Filters Guide.
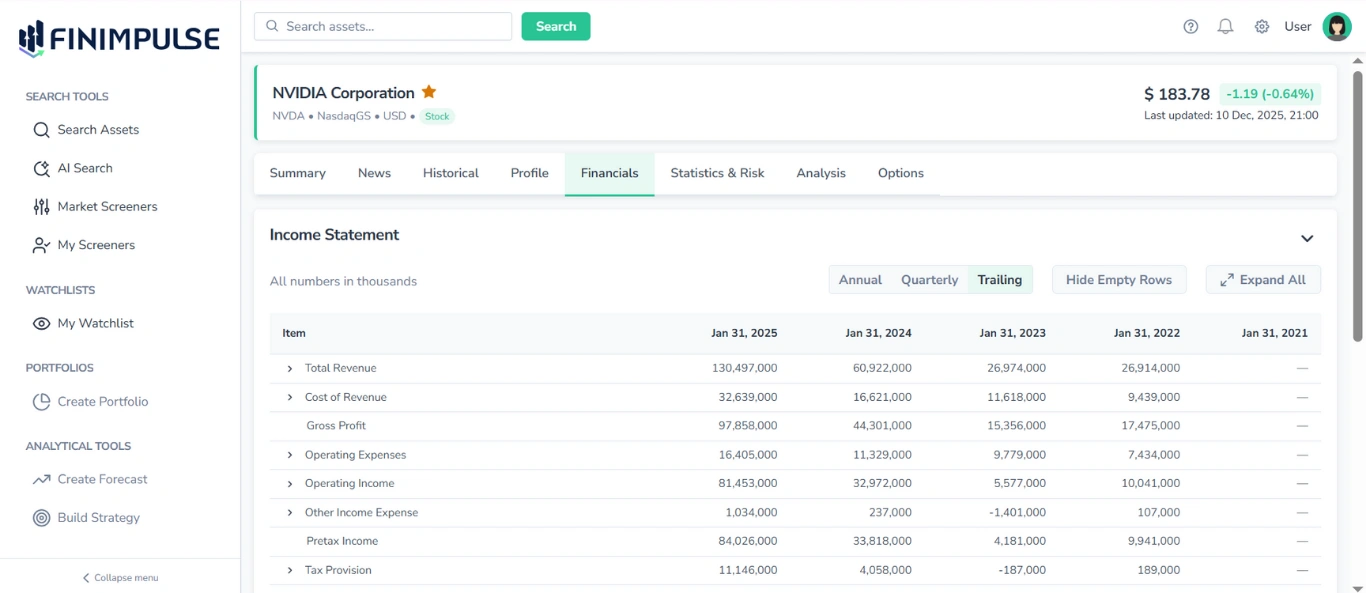
1. Key Controls and Tables Features
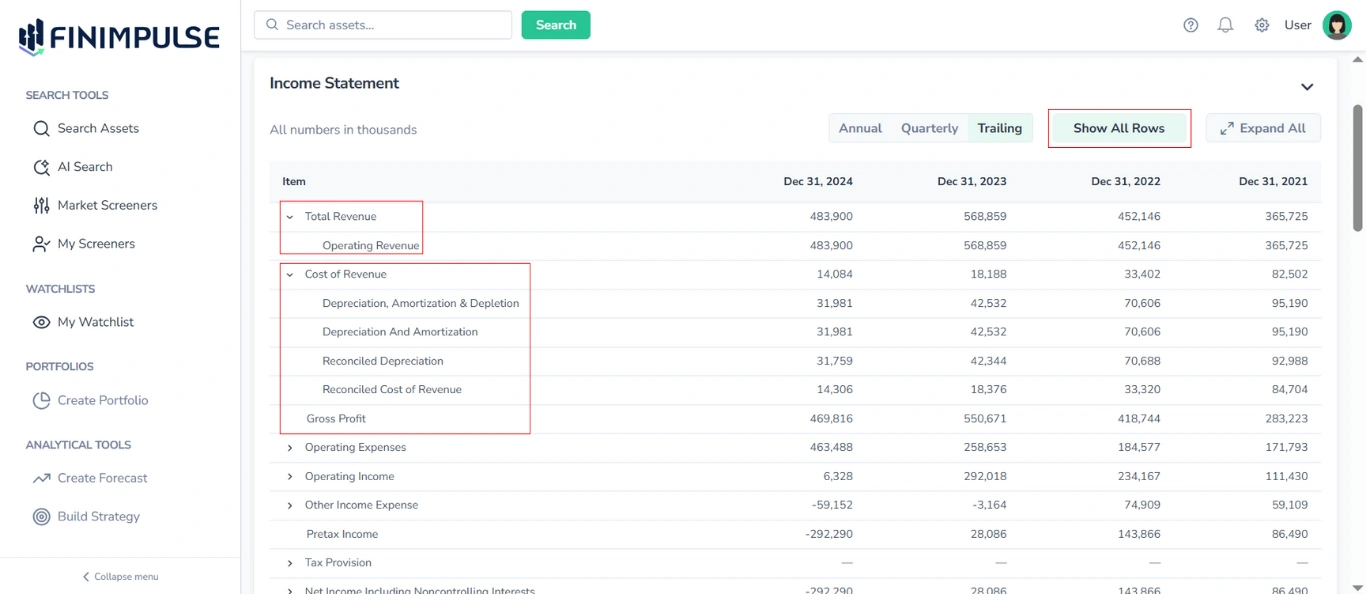
The Financials tab consists of three main sections, each containing a separate table:
- Income Statement
- Balance Sheet
- Cash Flow
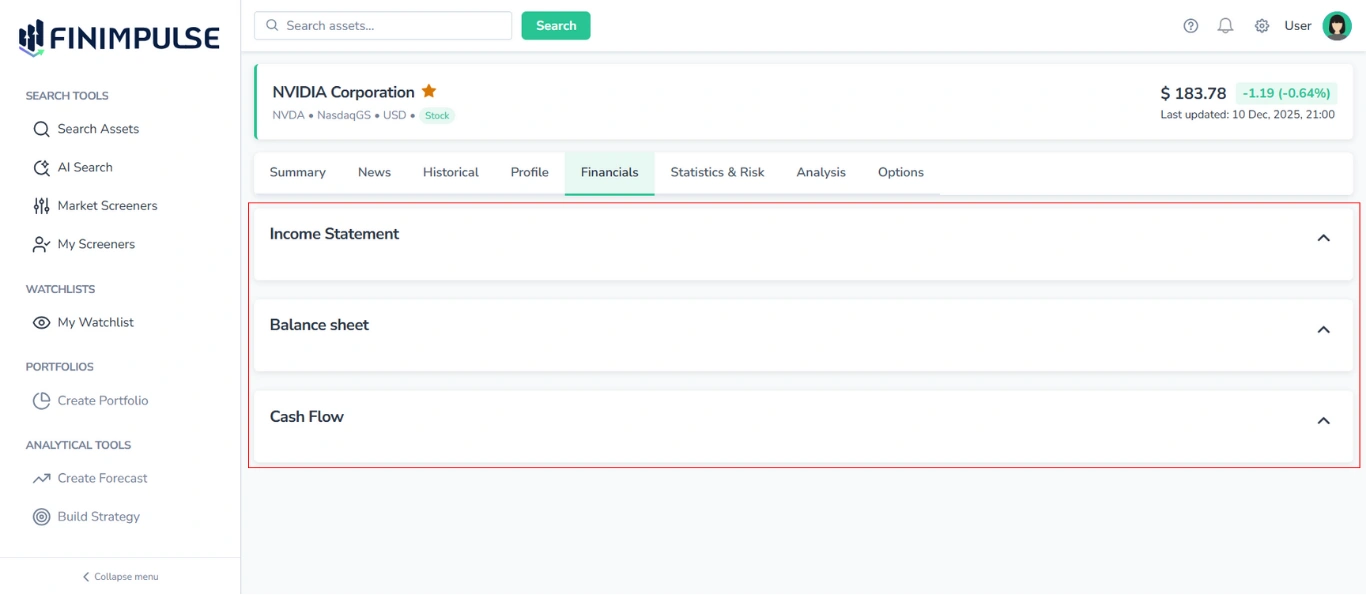
1.1. Section Controls
Each section can be individually expanded or collapsed by clicking anywhere on the top area of the section.
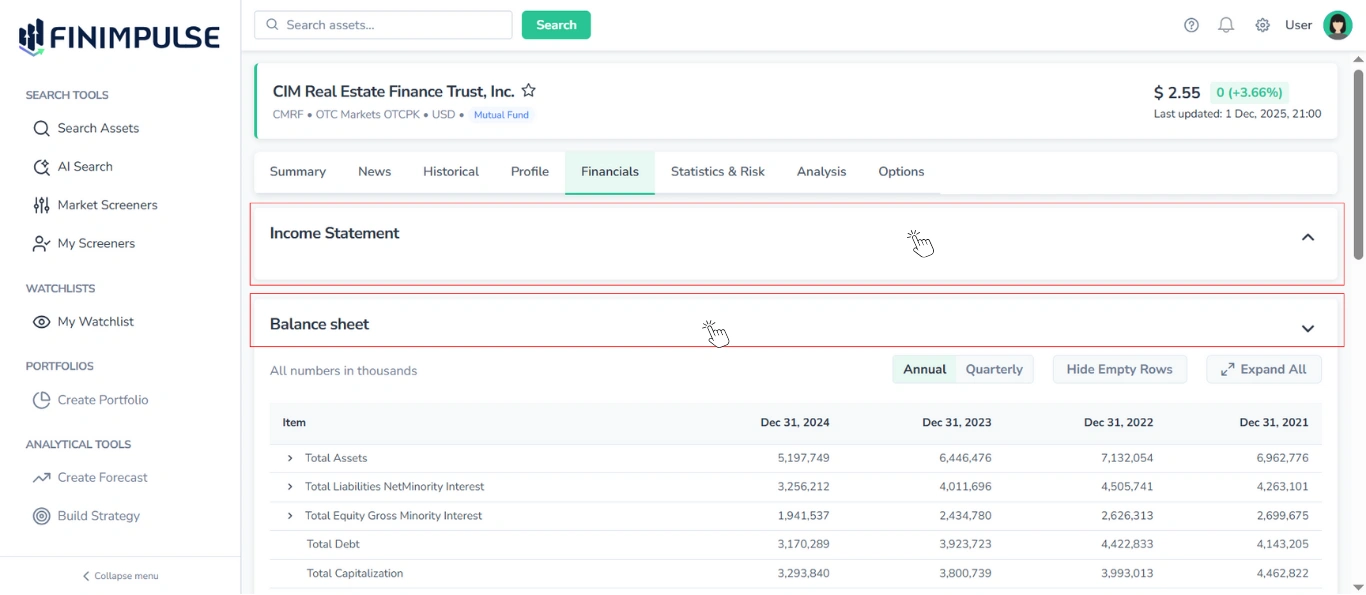
Note: By default, only the first section (Income Statement) is expanded, while the other two sections (Balance Sheet and Cash Flow) are collapsed. You can expand or collapse any section as needed.
1.2. Table Structure
All three tables share the same structure:
- Rows are organized into multiple levels (first, second, third, etc.):
- First-level rows are always visible.
- Rows of deeper levels (second, third, fourth, etc.) can be expanded or collapsed, either by clicking on a specific row or by using the Expand All/Collapse All button to show or hide all rows of deeper levels at once.
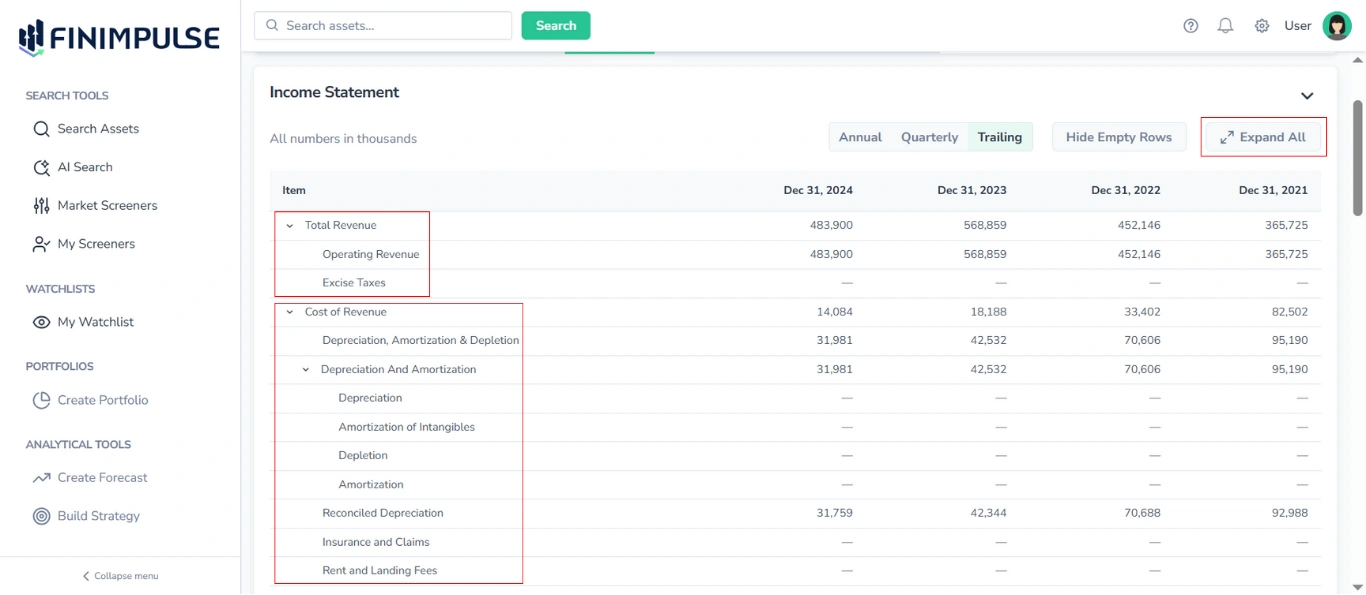
- Columns:
- The first column lists the financial items (e.g., Total Revenue, Operating Cash Flow, Working Capital).
- The following columns display values for different reporting periods (dates), which update based on the selected view mode (see below).
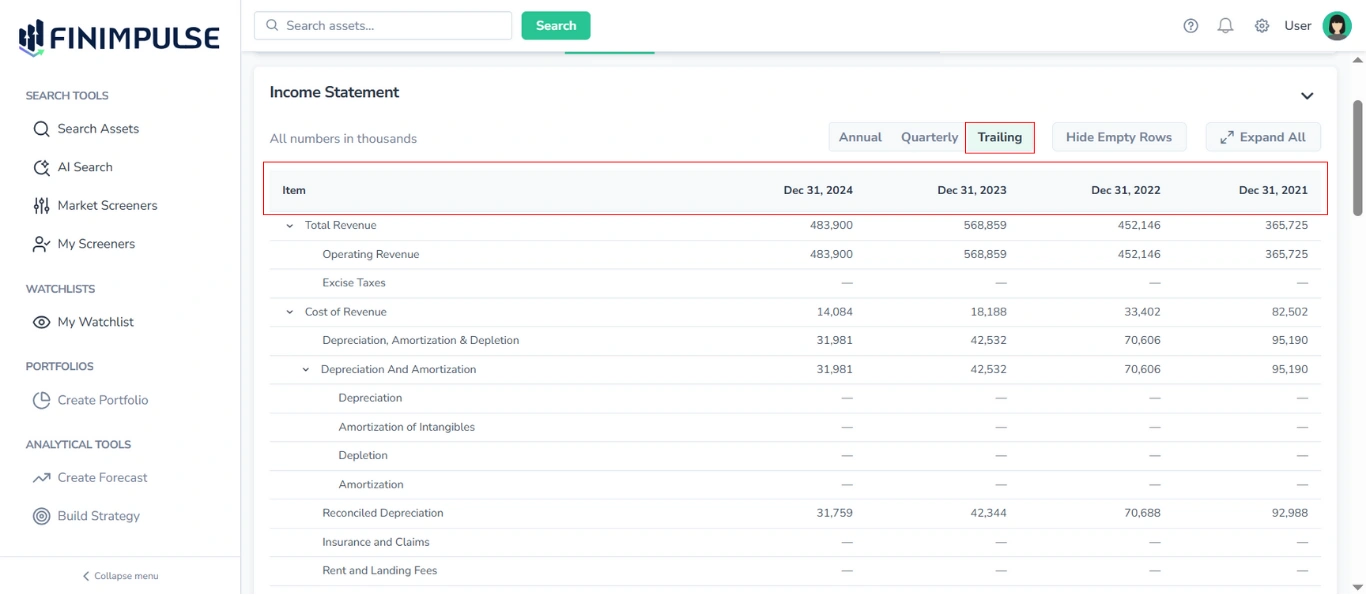
1.3. View Mode Selector
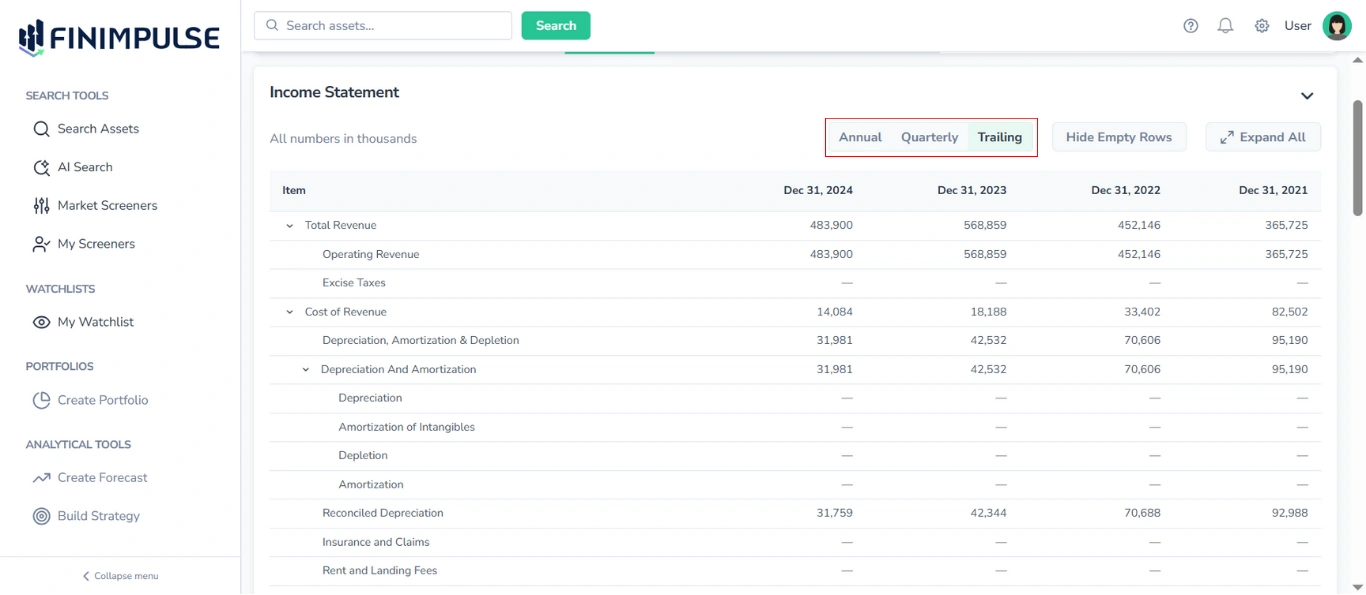
Each table allows you to switch between available reporting intervals:
- Income Statement and Cash Flow: Annual/Quarterly/Trailing
- Balance Sheet: Annual/Quarterly
Switching the view mode updates the date columns accordingly to display figures for the selected periods.
1.4. Row Display Options
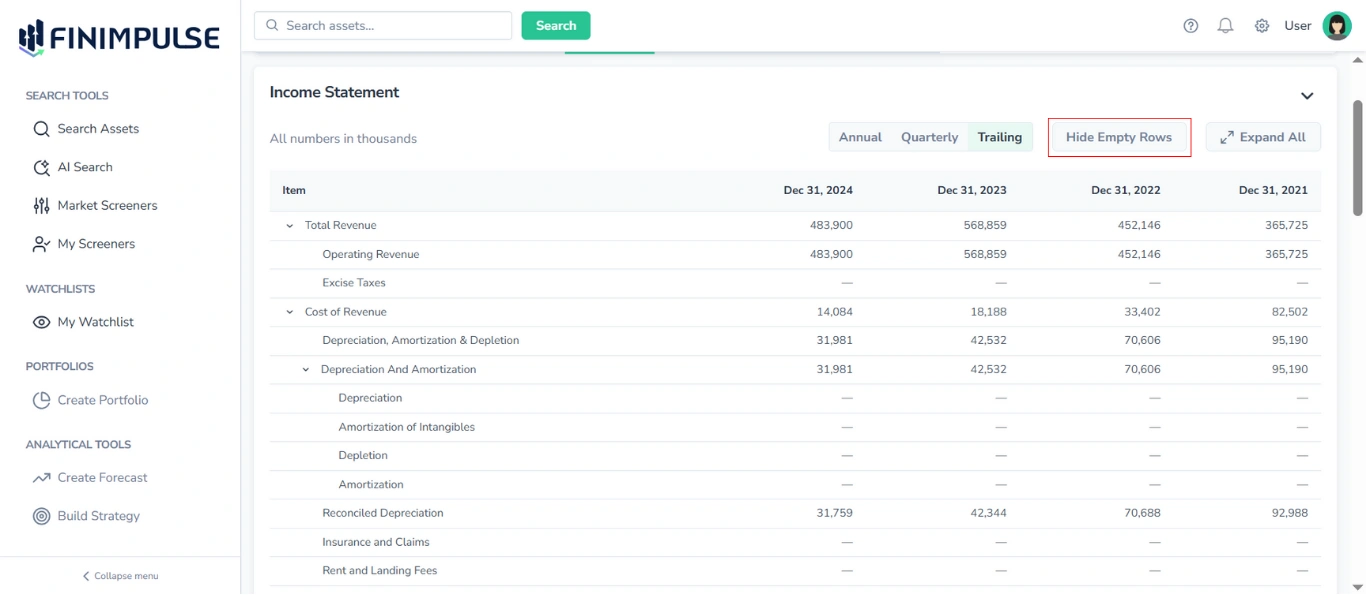
Each table includes a Hide Empty Rows/Show All Rows button, allowing you to hide or display empty rows at the second level and deeper. First-level rows are always visible, even if they do not contain any data.
All control buttons and view mode selectors operate independently for each table. Adjustments in one section do not affect the others.
Important: All numbers are shown in thousands for readability. If a value appears as 0, it means the actual figure is less than 500 and has been rounded down to zero due to the thousands format.