Understanding Market Activity: Most Active, Most Shorted & Penny Stocks Explained
A simple guide to different categories of market activity and what they mean.

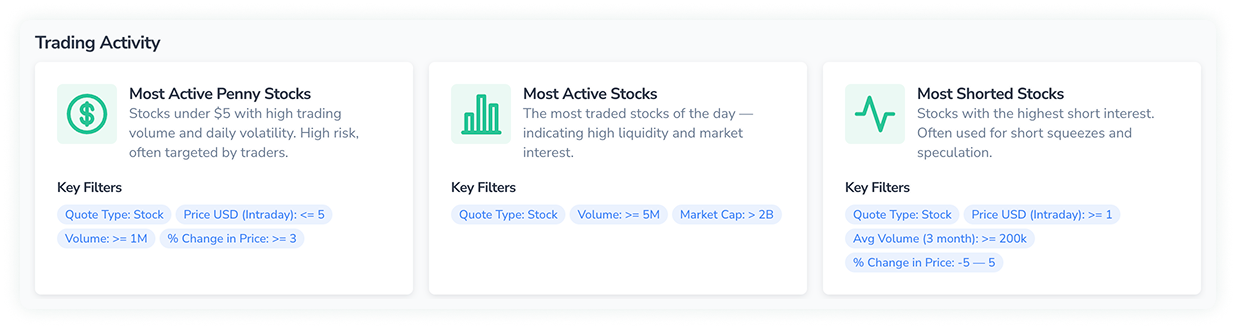
Every market day has its heartbeat — measured not just by price, but by activity. The Trading Activity screeners in FinImpulse capture this pulse in three distinct ways: Most Active Stocks, Most Shorted Stocks, and Most Active Penny Stocks. Together, they show where capital flows, how market participants behave, and which tickers dominate today’s attention.
1. Most Active Stocks
The Most Active Stocks screener highlights companies with the highest volume and market participation. FinImpulse filters them by:
- Quote Type: Stock
- Market Cap: > $2B
- Volume: ≥ 5M
These are the heavyweights — Apple, Microsoft, Tesla, NVIDIA — where millions of shares change hands daily.
High activity doesn’t always mean high volatility; it often means high liquidity, tighter spreads, and stronger institutional participation.
How to read it:
- Rising volume without significant price movement → accumulation phase.
- Price up + volume up → trend confirmation.
- Price up + volume down → weakening momentum.
- Price down + volume spike → possible distribution or correction.
For long-term analysis, this screener serves as a barometer of where capital is currently flowing.
2. Most Shorted Stocks
The Most Shorted Stocks screener tracks tickers with the highest short interest — shares borrowed and sold by market participants expecting a price decline. FinImpulse uses filters such as:
- Price USD (Intraday): ≥ $1
- % Change in Price: −5% to +5% (to exclude extreme outliers)
High short interest often signals fear or skepticism, but it can also be fuel for explosive rallies. When prices start rising, and short sellers rush to cover, that’s a short squeeze — one of the most dramatic events in markets.
Example: Meme stocks like GameStop or AMC in 2021 became case studies for short squeezes, where retail momentum clashed with hedge fund positions.
Tip: Combine this screener with FinImpulse indicators, such as volume, RSI, or price momentum, to identify conditions associated with short-squeeze activity.
3. Most Active Penny Stocks
Penny stocks are priced under $5 and attract speculative interest due to their low price and sharp intraday swings. FinImpulse identifies them with filters:
- Price USD (Intraday): ≤ $5
- Volume: ≥ 1M
- % Change in Price: ≥ +3%
These stocks can gain (or lose) 20–50% in a single session. They are often low-float companies in biotech, mining, or early-stage tech sectors and are monitored for sharp price movements — but carry extreme risk.
What to watch:
- Volume vs average: sudden 10× spikes hint at hype or insider flows.
- Market Cap: below $300M → higher manipulation risk.
- Repeated patterns: frequent daily jumps may indicate pump-and-dump cycles.
FinImpulse helps separate genuine momentum from noise by showing consistent historical metrics and liquidity stats.
How to Use Market Activity Screeners Together
Each screener answers a different question:
- Most Active Stocks: Where is real capital flowing?
- Most Shorted Stocks: Where is fear or speculation concentrated?
- Most Active Penny Stocks: Where is volatility highest today?
Using them together provides a complete view of market energy. For example:
- If activity rises in large caps → institutions are moving.
- If it shifts to penny stocks → the market is turning speculative.
- If shorted names spike on volume → a squeeze or sentiment reversal may be forming.
FinImpulse lets you switch between these filters instantly, adjust columns (performance, averages, volumes), and export results — giving you a dynamic snapshot of global market activity.
Bottom Line
Market activity is the real-time indicator of interest, risk, and sentiment. Whether you’re watching the giants that move billions, the shorted names at risk of a squeeze, or the penny stocks lighting up retail chats — FinImpulse helps you track it all with clarity and precision.