
Currency Normalization in Global Financial Data: A Technical Overview
A guide to converting multi-currency financial data to USD: the infrastructure requirements and how FinImpulse handles this.

When building systems that analyze assets across multiple markets, you may encounter a practical problem: a stock on the Tokyo Exchange is priced in JPY, a European ETF in EUR, a Brazilian stock in BRL. Comparing or aggregating these assets requires converting them to a single baseline currency.
In practice, that baseline is USD, because it dominates global benchmarks, financial models, and cross-market analysis workflows.
The Core Problem
Converting a price is usually just two steps — take the value and apply the rate. This works for current data, but historical prices require more.
The key issue is that exchange rates fluctuate every day. A price from six months ago must be paired with the exchange rate from that exact date. Applying the wrong rate introduces systematic errors that compound across a long dataset.
And even that’s not the full picture. Consider a case where a regional market is open on a day when forex data has a gap — a local holiday in one region, a market closure in another. Which rate would you apply?
This introduces infrastructure complexity — you need to:
- Maintain accurate daily exchange rates across decades
- Apply them correctly to each record
- Handle edge cases (weekends, holidays, missing data)
- Ensure consistency across the entire dataset
The FinImpulse API handles this at the data layer.
USD-Normalization in FinImpulse API
FinImpulse provides data across 95+ global markets, and many assets trade in currencies other than USD. To support historical analysis across these markets, the histories endpoint includes server-side USD conversion, with the following logic:
- Prices are converted using the close rate for each corresponding date.
- When a rate is unavailable for a given day, the most recent one is applied.
To request USD-normalized data, use the “use_usd” boolean parameter. By default, it is set to false, meaning prices are returned in the asset’s native currency. When set to true, the API returns prices normalized to USD.
To avoid ambiguity, every response includes a “currency” field that indicates the currency in which prices are returned.
Response Example (JSON)
Here is a sample of historical data for Toyota Motor Corporation. Its native currency is JPY.
{
    "task_id": "656e472f-18c1-4966-9f86-59205688cc71",
    "status_code": 20000,
    "status_message": "OK",
    "cost": 0.00025,
    "data": {
        "symbol": "7203.T",
        "limit": 2,
        "offset": 0,
        "use_usd": true
    },
    "result": {
        "symbol": "7203.T",
        "quote_type": "stock",
        "currency": "USD",
        "time_offset": 32400,
        "exchange_timezone_name": "Asia/Tokyo",
        "full_exchange_name": "Tokyo",
        "display_name": null,
        "market_region": "JP",
        "total_count": 6748,
        "search_after_token": "eyJSZXF1ZXN0RGF0YSI6eyJzeW1ib2wiOiI3MjAzLlQiLCJ1c2VfdXNkIjp0cnVlLCJ0eXBlcyI6bnVsbCwiaW50ZXJ2YWwiOm51bGwsInN0YXJ0X2RhdGUiOm51bGwsImVuZF9kYXRlIjpudWxsLCJxdWVyeSI6bnVsbCwib3JkZXJfYnkiOm51bGwsImxpbWl0IjoyLCJvZmZzZXQiOm51bGwsInVpZCI6bnVsbH0sIlNlYXJjaEFmdGVyRGF0YSI6eyJWZXJzaW9uIjoxLCJTZWFyY2hBZnRlclZhbHVlcyI6eyJkYXRlIjoiMjAyNi0wMi0yNCJ9LCJUb2tlblJlYWxPZmZzZXQiOjIsIlRvdGFsQ291bnQiOjY3NDh9fQ==",
        "items_count": 2,
        "items": [
            {
                "type": "historical_price",
                "open": 23.63414463,
                "high": 23.99214087,
                "low": 23.5254672,
                "close": 23.7811788,
                "adj_close": 23.7811788,
                "volume": 154833.3738,
                "date": "2026-02-25"
            },
            {
                "type": "historical_price",
                "open": 23.60326516,
                "high": 23.64179062,
                "low": 23.25011511,
                "close": 23.47484696,
                "adj_close": 23.47484696,
                "volume": 133911.930596,
                "date": "2026-02-24"
            }
        ]
    }
}
In the request, we set:
"use_usd": true
— and the response shows:
"currency": "USD"
This means all returned prices in the array are in USD.
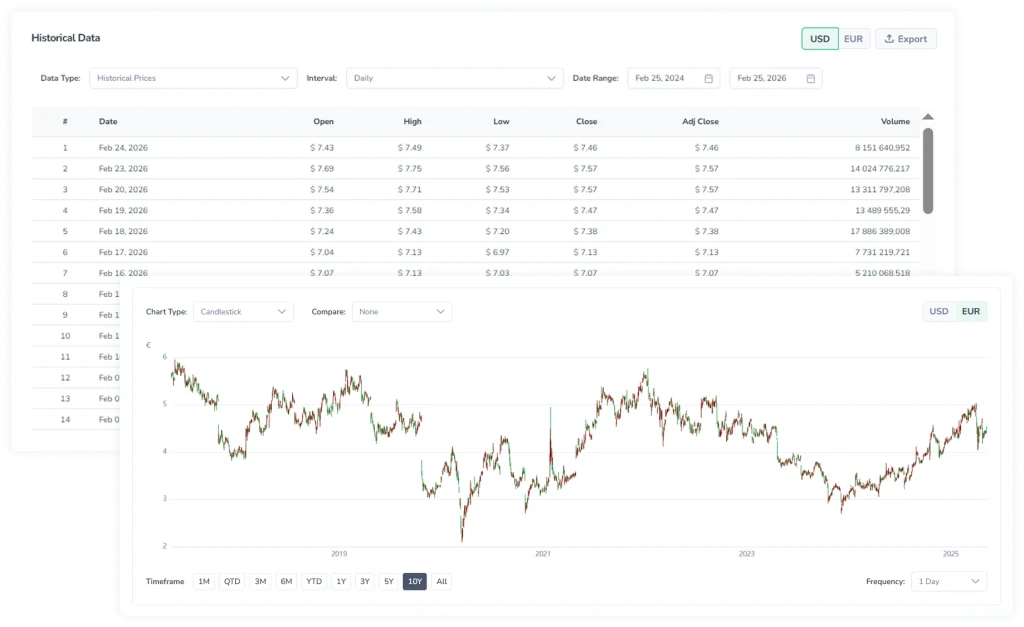
Dashboard Example
The histories endpoint powers the Historical section in the FinImpulse dashboard. This is where you can see how USD normalization works in practice before building your own implementation.
The section renders OHLCV data in two blocks:
- Interactive chart — visualizes price movements over time.
- Data table — lists each daily record with open, high, low, close, and volume values.
Both views include a currency toggle in the top-right corner that lets the user switch between the native currency and USD-normalized values.
Bottom Line
USD-normalized data is a crucial foundation for any application that requires reliable multi-market price information.
FinImpulse handles all of this — daily USD normalization, missing rates, and clear currency labeling are built into the API.
Register and get $1 gift credit. No top-ups required — start testing immediately.