
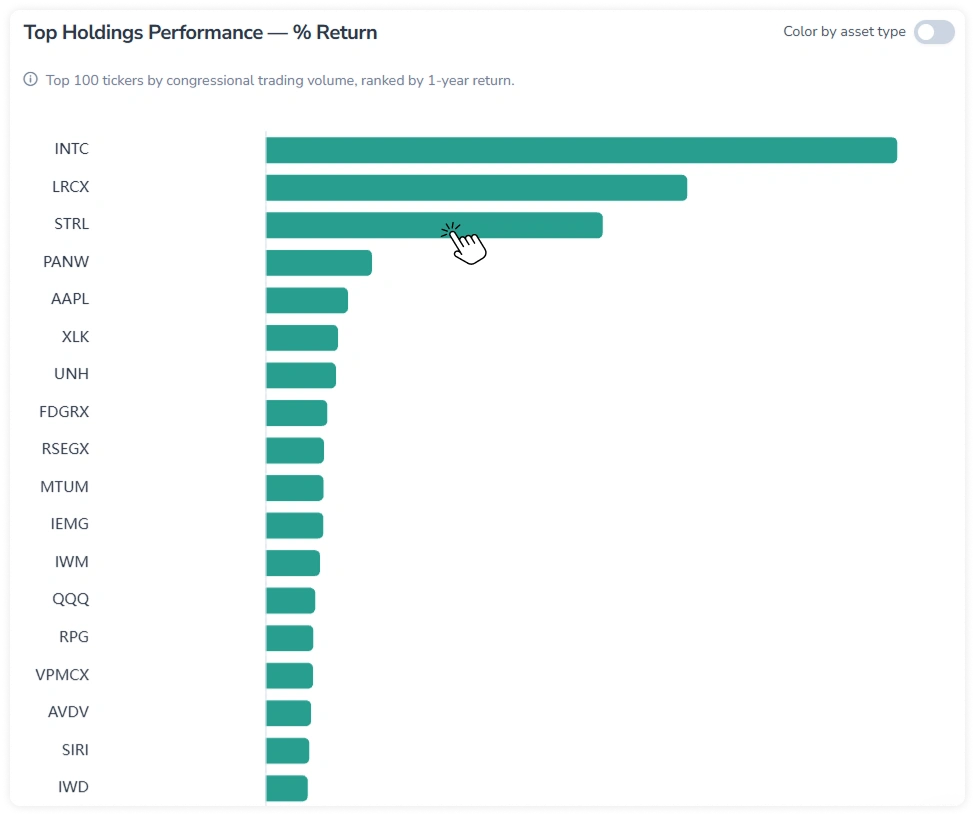
The Performance tab displays the 1-year price performance of the top 100 tickers by congressional disclosure volume as a horizontal bar chart, ranked from highest to lowest.
The tab includes a Filters panel at the top that contains a field for searching by politician name, an All/Democrat/Republican toggle (filters the chart by party affiliation), and a date range picker. The panel is sticky and can be collapsed using the arrow in the top-right corner.
1. Key Behaviors
The chart shares the following interactive features.
1.1. Tooltip on Hover
Hover over a bar to display a tooltip with the corresponding asset name and performance value.
1.2. Navigation
Press a bar to navigate to the corresponding ticker page.
1.3. Color by Asset Type Toggle
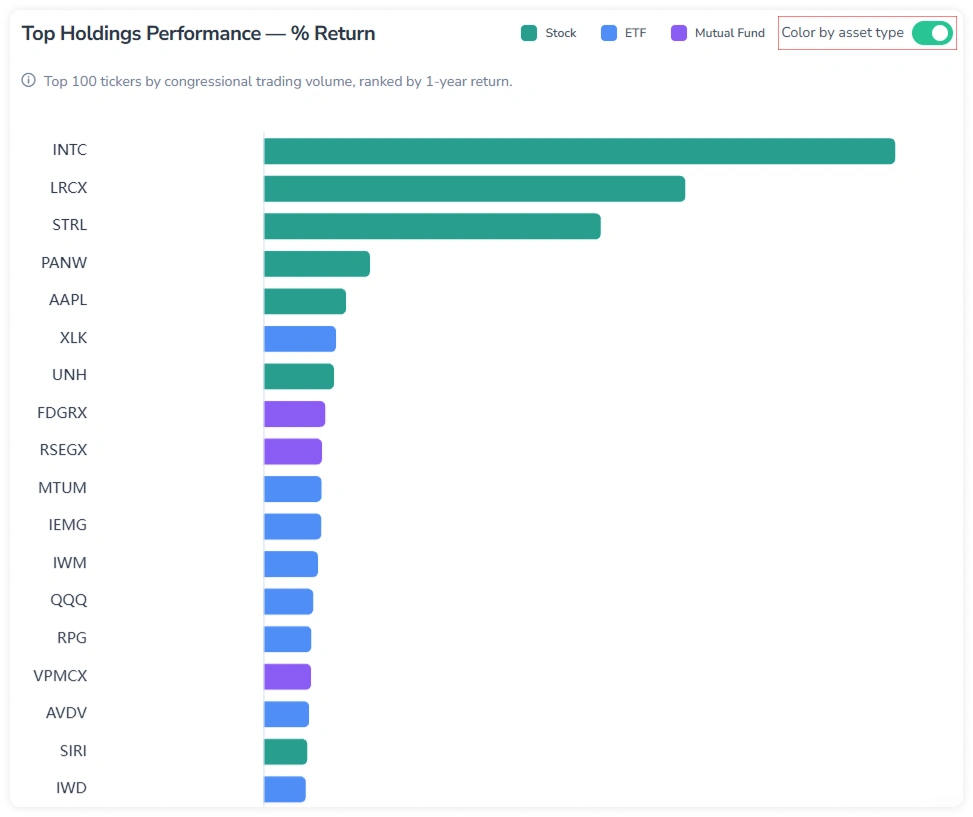
The chart includes a Color by asset type toggle. When enabled, bars are color-coded by asset type:
- Stock — green
- ETF — blue
- Mutual Fund — purple
When disabled, bars are color-coded by price change direction — positive in green, negative in red.