
The Trades tab contains transaction-level disclosure data and is organized into two data blocks.
The first block includes three sections adjustable via the time range selector (90D, 6M, 1Y, 5Y) located in the top-right corner of the block:
- Largest Trades: A list of the highest-value disclosed transactions for the period.
- Delay Distribution: A breakdown of filings by the number of days between transaction and report dates.
- Trades by Owner: A distribution of transactions by owner type (Self, Spouse, Joint, Child).
The second block includes:
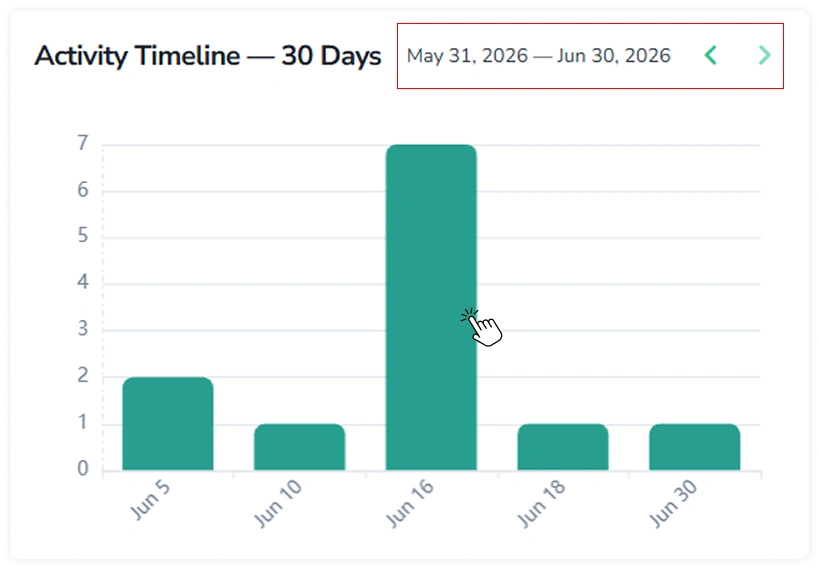
- Activity Timeline: A bar chart showing transaction count per day over a 30-day window.
- Transactions: A full transaction table filterable by politician, ticker, and date range.
The two are linked: press a bar on the chart to filter the table to that specific date.
1. Key Behaviors
Hover over the Trades by Owner chart and the Activity Timeline bar chart to display a tooltip with the corresponding label and value.
2. Activity Timeline and Transactions Block
2.1. Activity Timeline Chart
The Activity Timeline chart displays transaction count per day over a 30-day window. The window can be navigated forward and backward using the arrows in the top-right corner of the section.
Each bar represents the number of transactions on a given date. Press a bar to update the Transactions table below to show records for that particular date.
2.2. Transactions Table
The Transactions table includes the following filters:
- Politician name: Search by politician name.
- Ticker: Search by ticker symbol or asset name.
- Date range: Set a custom date range via the date picker in the top-right corner, or by pressing a bar on the Activity Timeline chart above.
To reset all active filters at once, press Clear Filter.
Press a ticker in the Ticker column to navigate to the corresponding ticker page.
In addition, the table uses color coding in several columns:
- Party: REP (Republican) in red, DEM (Democrat) in blue, IND (Independent/Not specified) in grey.
- Delay: Color intensity increases with the number of days elapsed between the transaction and report dates.
- Type: Buy entries are displayed in green; Sell entries are displayed in red.
The table supports sorting and pagination. To learn how sorting works, refer to the Sorting Guide.