
The Overview tab provides an aggregate view of congressional disclosure activity for the selected period. It includes summary figures for total trades, buy and sell amounts, followed by three sections:
- Sector Allocation Heatmap: Sector distribution of disclosed trades by party and chamber.
- Amount by Ticker & Sector: Disclosed volume by asset across the full ticker universe.
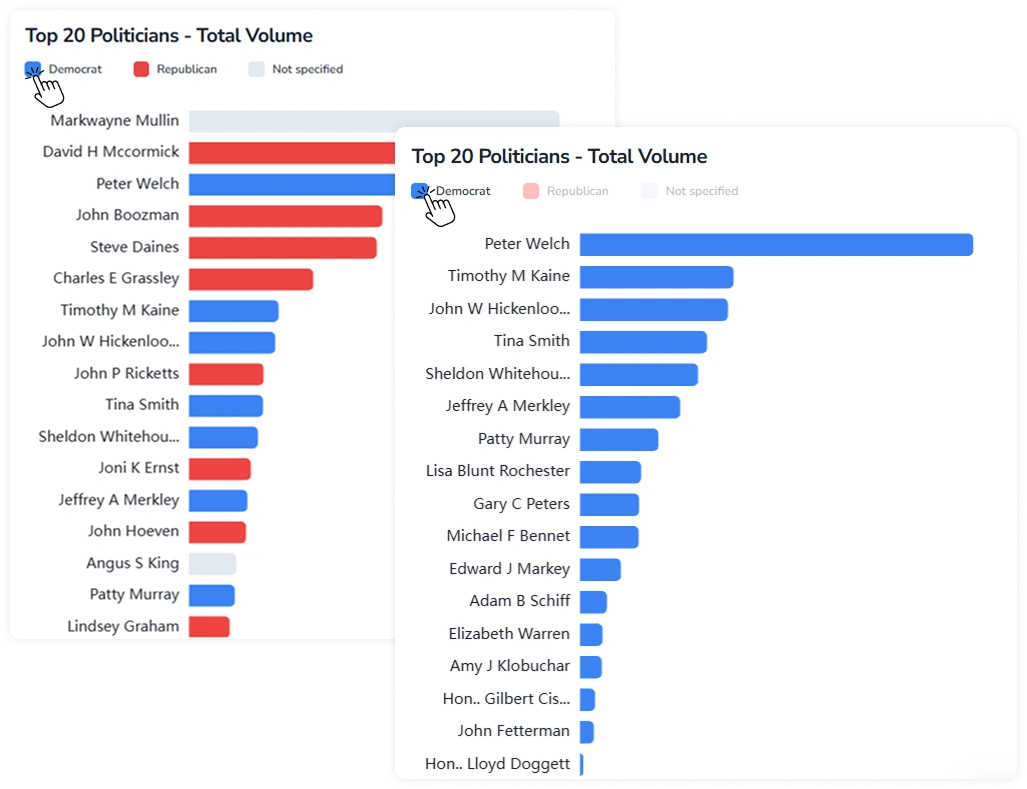
- Top 20 Politicians: Top politicians ranked by total disclosed volume for the selected period.
The tab also includes a Filters panel at the top, which applies to all three sections. It contains a time range selector with preset options (Month, Quarter, Year) and a custom date range picker. The panel is sticky and can be collapsed using the arrow in the top-right corner.
1. Key Behaviors
Sections in the tab share the following interactive features.
1.1. Tooltip on Hover
Hovering over any element across all three sections — a heatmap cell, a treemap tile, or a bar — displays a tooltip with the corresponding label and value.
1.2. Toggling Legend Items
The Amount by Ticker & Sector and Top 20 Politicians sections include an interactive legend with sector/party names and colored indicators.
- Press a legend item to isolate the corresponding group.
- Press again to restore the full view.
2. Amount by Ticker & Sector Section Controls
The Amount by Ticker & Sector section displays disclosed volume by asset as a treemap. Press a particular ticker tile to navigate to the corresponding ticker page.
The view can be filtered using the following controls:
- Transaction type: Filter by All, Sells, or Buys to display total disclosed volume, sell-side only, or buy-side only.
- Chamber: Filter by All, House, or Senate to display disclosures from all members, House members only, or Senate members only.
- Ticker count: Limit the number of tickers displayed in the treemap to the Top 20, Top 50, or All.