
FinImpulse Node for n8n: Market Data in Automated Workflows
An overview of the FinImpulse node for n8n — available operations, verified status, and a working ETF metrics workflow.

FinImpulse is now available as a verified node on n8n. The integration allows financial data — prices, fundamentals, analyst insights, and risk metrics — to be pulled directly into n8n workflows and connected to the broader ecosystem of apps the platform supports.
This article covers the operations available in the FinImpulse node and walks through a working workflow example using real market data.
What the FinImpulse Node Includes
The node exposes three resource groups, each covering a distinct category of financial data.
Market Data
Covers core market data across stocks, ETFs, and funds:
- Search Assets — returns assets matching a search query across stocks, ETFs, and funds
- Get Price History — retrieves time-series price data, including dividends and splits
- Get Asset Summary — returns a snapshot of an asset: current price, fundamentals, and key metrics
- Get Asset Profile — returns company information, sector and industry classification, exchange details, and other descriptive metadata
- Get News — returns recent news and press releases associated with a given asset
Analyst Insights
Covers sell-side and consensus data for equities:
- Get Earnings Data — historical and forward earnings figures
- Get Recommendation Trends — aggregated analyst buy/hold/sell consensus over time
- Get Analyst Actions — individual analyst rating changes and price target updates
- Get Analyst Ratings — current analyst rating distribution
Financial Statistics & Risk
Provides quantitative metrics for performance and risk assessment:
- Get Key Metrics — valuation ratios, volume data, dividend yield, moving averages, 52-week range metrics, and related market indicators
- Get Risk Metrics — beta, standard deviation, and other risk-adjusted indicators
- Get Annual Returns — yearly return figures for performance comparison
These operations can be used independently or combined into multi-step workflows — pulling data, filtering it, and routing the output to databases, spreadsheets, or messaging tools.
Let’s consider a simple workflow that puts one of them to work.
Workflow: Daily ETF Metrics Snapshot to Google Sheets
Tracking key metrics for an ETF on a daily basis is a common analytical task — and a straightforward one to automate. The goal is simple: pull key metrics for a specific ETF once a day and append them to a Google Sheet for historical tracking and analysis.
Over time, this builds a structured log of daily figures — price levels, volume, dividend yield, valuation ratios — without any manual data collection.
Three nodes are enough to set this up:
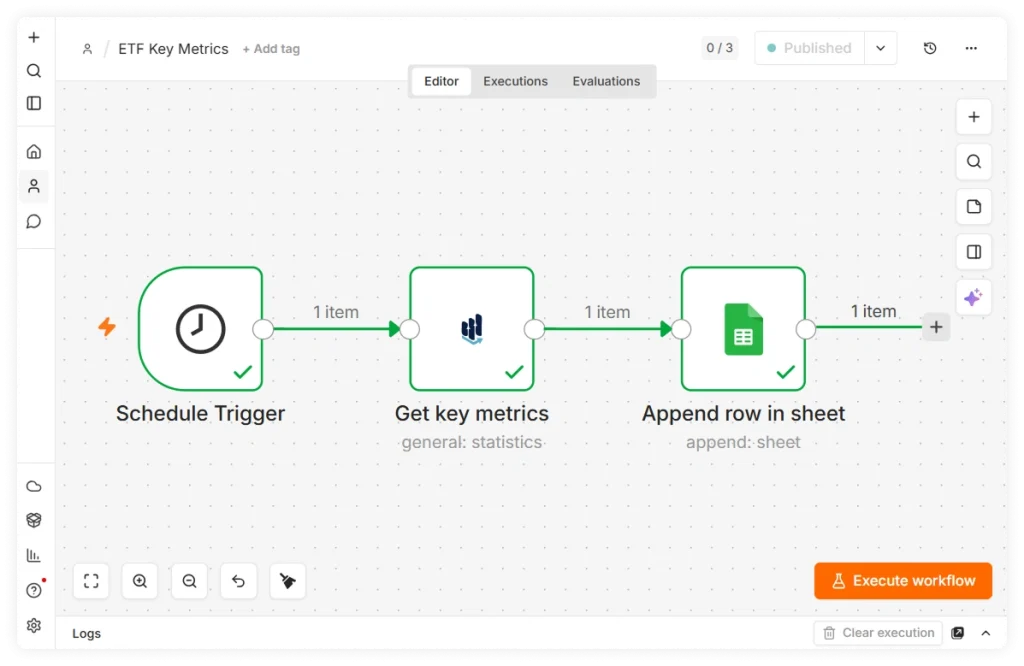
1. Schedule Trigger
The first node is a Schedule Trigger. It sets the automation cadence — for a daily snapshot, configure it to run once per day at a fixed time. n8n will execute the workflow automatically at each interval.
2. FinImpulse — Get Key Metrics
Next, add a FinImpulse node, set the resource to Financial Statistics & Risk, and select the Get Key Metrics operation. Enter the ticker symbol in the Asset Identifier field — in this example, SPY.
On execution, the node returns a single item covering current and historical price levels, volume figures, dividend yield, valuation ratios, and 52-week range data.
3. Google Sheets — Append Row
The final node is Google Sheets. Connect it via OAuth2, select the target spreadsheet and sheet, and set the Mapping Column Mode to Auto-Map — the node will automatically map all fields from the FinImpulse output to corresponding columns.
Once the workflow is saved and activated, it runs automatically on the configured schedule. The result is a growing dataset — one row per day — that can be used for trend analysis, reporting, or as an input to further automation.
Other Automation Scenarios
The workflow above uses a single ETF and a single destination, but the same approach can be applied to a wide range of financial automation tasks.
For example, analyst rating changes can trigger Slack or email notifications when analyst coverage changes on a tracked stock. News updates can be delivered to internal channels, databases, or document systems for monitoring and research. Risk and performance metrics can be collected on a schedule and stored for historical analysis. Earnings data can be automatically logged and used to generate recurring reports.
In most cases, the workflow structure remains the same: a trigger, a FinImpulse operation, and a destination. The output can be routed to Google Sheets, databases, messaging platforms, CRMs, internal dashboards, or other applications available within the n8n ecosystem.
All you need is an n8n account and a FinImpulse API token to start building workflows with market data.