
Alpha vs Beta: Why They Differ Across Stocks, ETFs, and Funds
Alpha and beta explained — understand how these metrics help assess risk and performance in ETFs and funds.

Not all assets perform equally across market conditions. Two assets can show similar price performance and still carry very different levels of risk. That’s where alpha and beta come in — two foundational metrics in modern portfolio theory that show how an asset performs relative to market risk — not just what its price change was.
This article clarifies what alpha truly represents, how it differs from beta, and why these metrics appear differently across various asset types, such as stocks, ETFs, and mutual funds.
What Is Beta? (A Quick Recap)
Beta measures how sensitive an asset is to the overall market’s movements, typically compared against a broad index such as the S&P 500 or the MSCI World.
- β > 1.0 → the asset moves more than the market (more aggressive).
- β < 1.0 → it moves less (more defensive).
- β ≈ 1.0 → it largely follows market trends.
- β < 0 (rare) → it moves inversely to the market.
In practice, beta provides context for volatility:
- A high-volatility asset often has a high beta (amplifies market sentiment).
- A low-volatility asset may have low beta (more insulated from macro swings).
This reinforces the concepts that beta is essentially volatility with direction and market correlation included.
What Is Alpha?
If beta measures risk relative to the market, alpha measures performance relative to a benchmark — answering the question:
Did this asset outperform or underperform what it was expected to deliver for its level of risk?
Alpha isolates the “skill” component of performance:
- Positive alpha (+1% or +3%) → the asset outperformed expectations.
- Negative alpha (–2% or –5%) → it underperformed relative to risk.
- Zero alpha → it performed exactly as expected.
Formula (simplified): Alpha = Actual Return − Expected Return (based on beta and benchmark). Where the benchmark is not arbitrary — it must be formally defined.
Why Alpha Exists for ETFs and Funds — but Not for Individual Stocks
This is a common source of confusion.
1. ETFs and Mutual Funds Always Have a Benchmark
They are built to track or beat a clearly defined index:
- S&P 500
- Russell 2000
- MSCI Emerging Markets
- Sector or style indices
This makes alpha calculation straightforward and consistent.
Example:
If an S&P 500 ETF shows 12% but the index shows 10% after adjusting for beta, its alpha is 2%.
2. Individual Stocks Do Not Have an Official Benchmark
AAPL is not designed to “beat the S&P 500” or “track NASDAQ 100.” It is not a portfolio — it is a company. So if you try to calculate alpha for a single stock, you run into a problem:
- Which benchmark should you choose? S&P 500? NASDAQ 100? Sector index? Global index?
Any choice becomes subjective — and therefore misleading. That’s why major data providers (Yahoo Finance, Morningstar, Reuters, Koyfin) do not calculate alpha for individual stocks. They only publish beta.
3. Alpha Without a Benchmark Loses Its Meaning
Alpha is only meaningful when the benchmark is formally linked to the asset. This is true for:
- Index ETFs
- Active mutual funds
- Smart beta and factor funds
- Portfolio models
But not for a single company’s stock
Why Beta Still Applies to Stocks
Even though alpha doesn’t apply, beta absolutely does. Stocks naturally move in relation to the broader equity market — some far more than others. For instance:
- High-growth tech stocks often have β = 1.3 to 1.8 (they amplify market trends).
- Defensive utilities or consumer staples often have β = 0.5 to 0.8 (they soften macro shocks).
This is why beta is still a key metric when analyzing stock-level risk, even if alpha is not provided.
Examples: Alpha vs Beta in Practice
Example 1: S&P 500 ETF (SPY)
- Benchmark: S&P 500
- Beta: 1.00
- Return: +11%
- Benchmark return: +10%
- Alpha: +1% (slight outperformance)
Example 2: Active Mutual Fund
- Benchmark: MSCI Europe
- Beta: 0.95
- Return: +7%
- Expected return: +5.5%
- Alpha: +1.5%
Shows fund manager skill (or benchmark outperformance).
Example 3: AAPL (Stock)
- Beta: 1.25
- Return: +14%
No alpha is published because there is no official benchmark against which to compare it. Any alpha estimation would depend on a subjective benchmark selection, which varies widely across platforms and analysts.
How Alpha and Beta Work Together
| Metric | What It Tells You | Applies To |
|---|---|---|
| Beta | Sensitivity to market movement | Stocks + ETFs + Funds |
| Alpha | Skill/outperformance vs benchmark | ETFs + Mutual Funds + Portfolios |
| Volatility (Read here about Volatility & Beta) | Magnitude of price swings | All assets |
| Drawdown / Sharpe / Sortino | Risk-adjusted performance | All assets |
Together they provide a full picture:
- Beta indicates how much risk an asset took relative to the market.
- Alpha tells you whether the benchmark was outperformed.
- Volatility tells you how turbulent the ride was.
How This Fits Into FinImpulse
FinImpulse delivers a unified, standards-based risk framework across stocks, ETFs, and mutual funds; however, each asset type exposes different metrics depending on its function in financial markets.
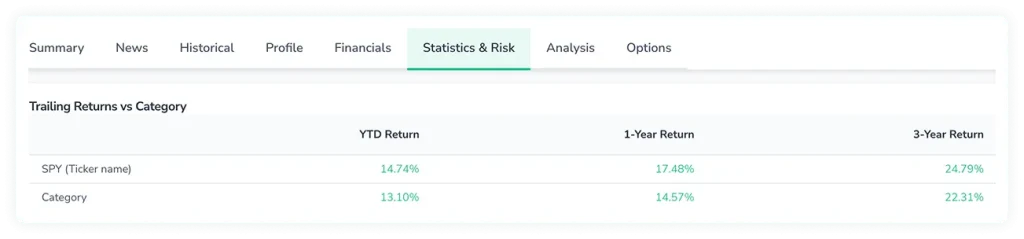
Where These Metrics Live
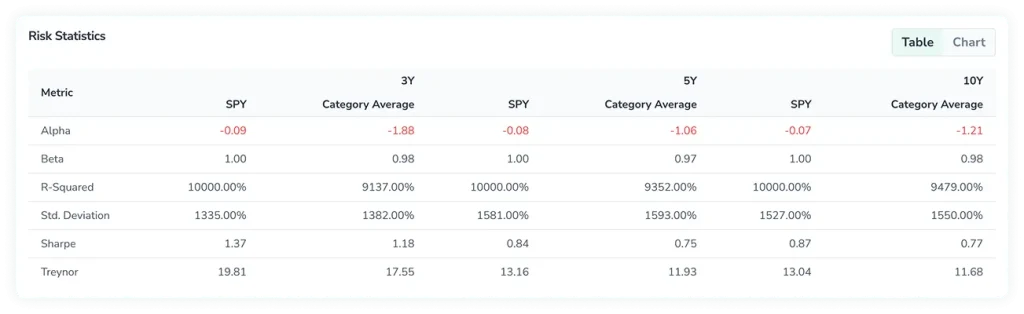
All core market, valuation, and risk indicators are combined inside the Statistics & Risk tab, which includes:
- standard deviation,
- beta (for all asset types),
- alpha (for ETFs and mutual funds only),
- Sharpe and Treynor,
- R-squared and benchmark-linked measures (for funds),
- price performance, drawdowns, and historical ranges.
Additional context appears across:
- Summary — headline valuation and price information,
- Historical — time-series data for volatility and price performance,
- Financials — fundamentals and financial ratios,
- Analysis — forward-looking indicators and estimates.
This keeps FinImpulse consistent with global providers while giving users a single, consolidated place to evaluate risk.
Beta in FinImpulse
Beta is available for all asset classes, including stocks, ETFs, and mutual funds. Inside Statistics & Risk, users can quickly:
- assess how strongly an asset moves relative to its market,
- compare high-beta and low-beta securities across sectors and regions,
- integrate beta via API into automated models, screeners, or portfolio tools.
Alpha in FinImpulse
FinImpulse calculates alpha only where the metric is valid and industry-standard — namely:
- ETFs, which track explicit benchmarks,
- Mutual funds, which are benchmarked by mandate or category.
Alpha is shown in Statistics & Risk alongside Sharpe, Treynor, R-squared, and category averages. We do not calculate alpha for individual stocks, because:
- stocks have no official benchmark,
- any benchmark choice would be arbitrary,
- this aligns with industry data sources (Morningstar, MSCI, Koyfin, Yahoo Finance).
This ensures FinImpulse never exposes misleading or non-standard metrics.
The Takeaway
FinImpulse follows the global standard for interpreting risk:
- Beta shows how much an asset responds to broad market movement,
- Alpha shows whether a benchmarked ETF or fund outperforms its expected return,
- Stocks display beta but not alpha, because they aren’t benchmark-linked portfolios,
- All risk metrics are consolidated in Statistics & Risk for clarity and consistency.
This gives analysts, researchers, and developers a clear, comparable view of risk — and a deeper understanding of how performance is measured, not just what the numbers show.