
What Does a “1Y Return” Really Mean?
A simple breakdown of what a 1-year return shows and how to read it correctly.
What Is “1Y Return”?
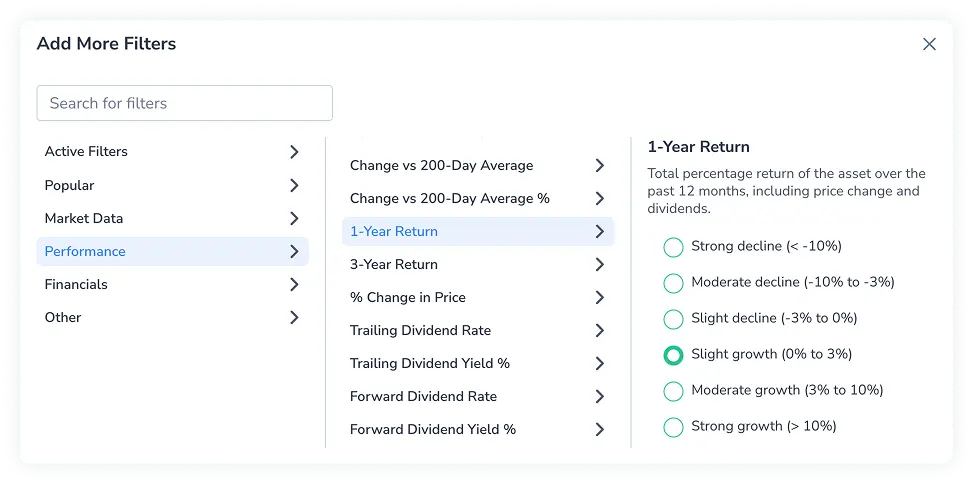
When you see “1Y Return +23.4%” next to an ETF like QQQ, it means the value of the asset has grown by 23.4% over the past year, counting from today back to the same date one year ago.
Note: The “1Y Return” indicator may be calculated differently depending on the platform. Some platforms include not only price changes but also paid dividends (total return), while others consider only price changes (price return). Always check which one is shown.
Let’s make it real. If you invested $10,000 in QQQ a year ago, today you’d have $12,340 — a gain of $2,340. Here’s how that math looks:
Example Calculation
If you had invested $10 000 one year ago, your position would now be worth:
| Example | Value |
|---|---|
| Initial investment | $10 000 |
| Growth (+23.4%) | +$2 340 |
| Current value | $12 340 |
But keep in mind — this money isn’t “yours” until you sell at least part of your holdings. Until then, it’s called unrealized profit — your portfolio is worth more, but no cash has been received.
Realized vs Unrealized Profit
Your gains are unrealized until you sell. Sell 20 shares at $123.40 each → you receive $2 468 cash (realized) and still hold 80 shares ($9 872 unrealized). Together = $12 340 total value.
Partial Sale Example
Suppose you own 100 shares worth $123.40 each. You decide to sell 20 of them:
- You receive $2,468 in cash (20 × $123.40) — that’s realized profit.
- You still hold 80 shares worth $9,872 — unrealized.
Together, your total value remains the same — but part is now real money, while the other part is still on paper.
FinImpulse Insight
Tracking 1Y Return helps you compare the yearly performance of assets, but it’s only part of the whole picture. This metric doesn’t account for all risks, doesn’t guarantee similar results in the future, and can be misleading during volatile periods.
We provide the data — you decide what’s right.