The Profile section in FinImpulse provides detailed information about the company or fund. The content varies depending on the asset type.
1. Profile Tab Content for Stocks
1.1. Company Profile
This section provides the main information about the company.
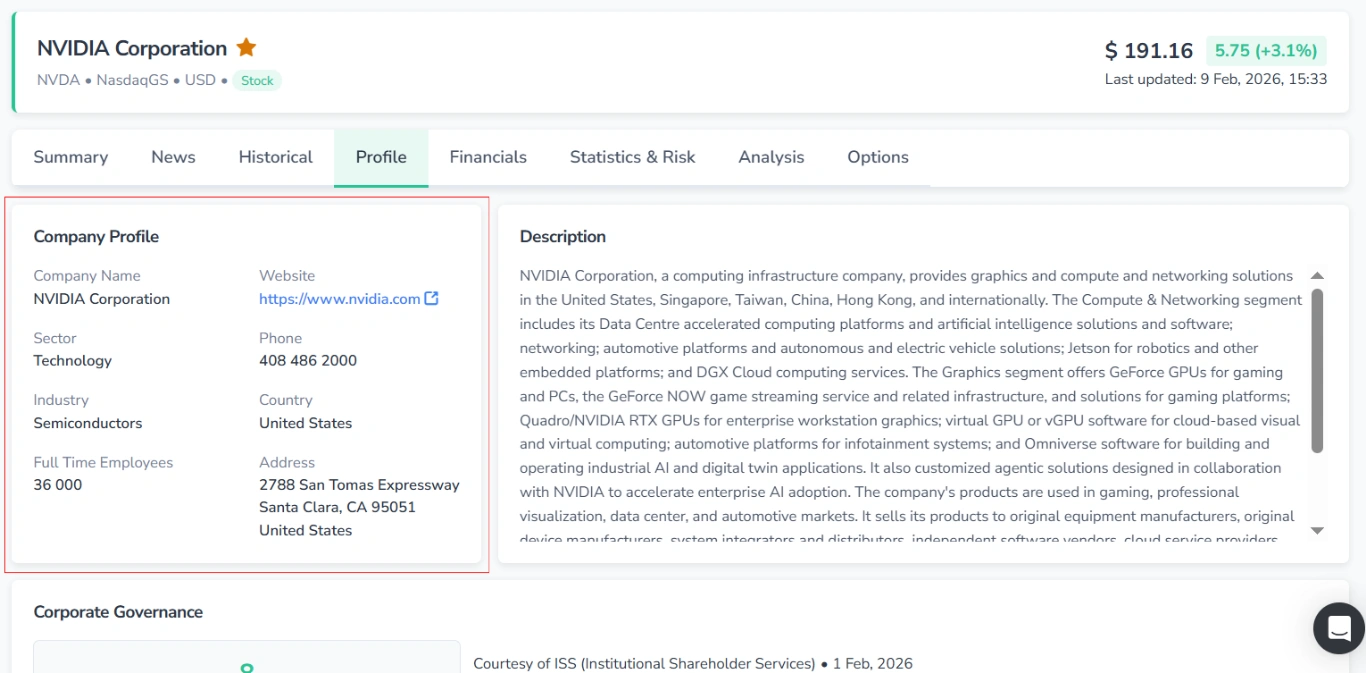
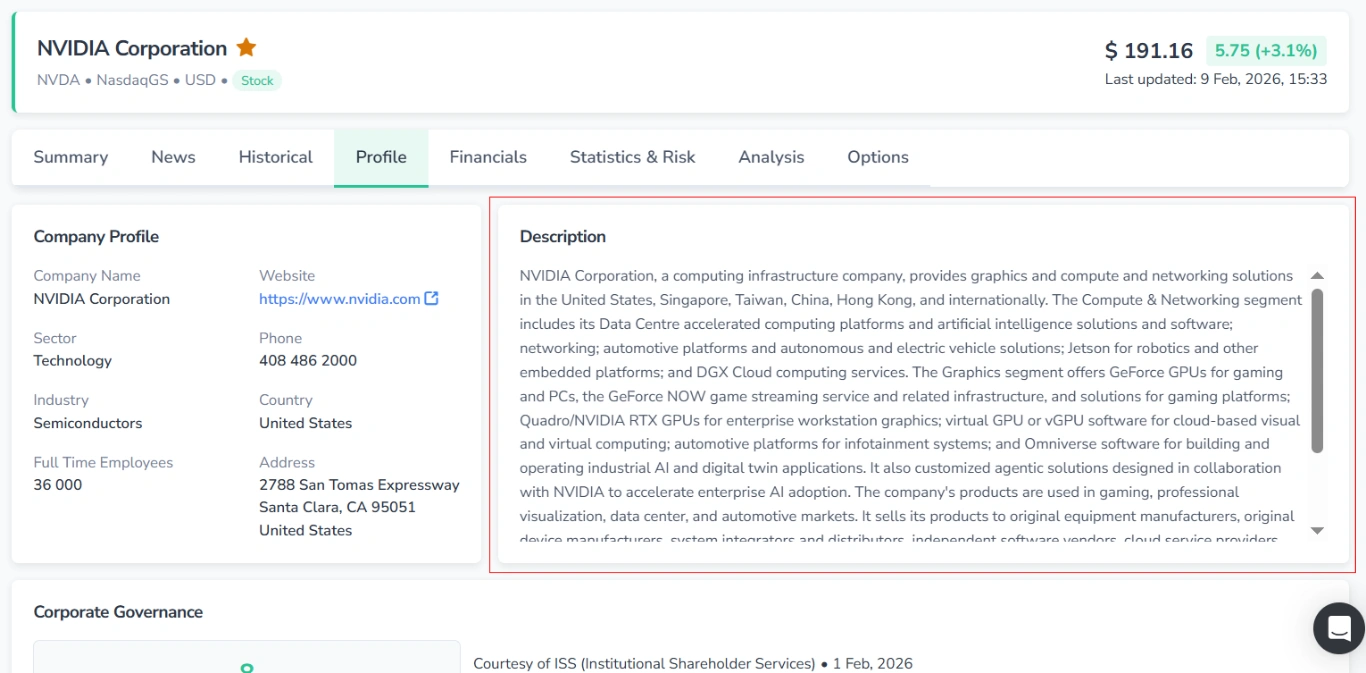
1.2. Description
A description of the company’s business and operations.
1.3. Corporate Governance
Here you can view an assessment of the company’s governance practices.
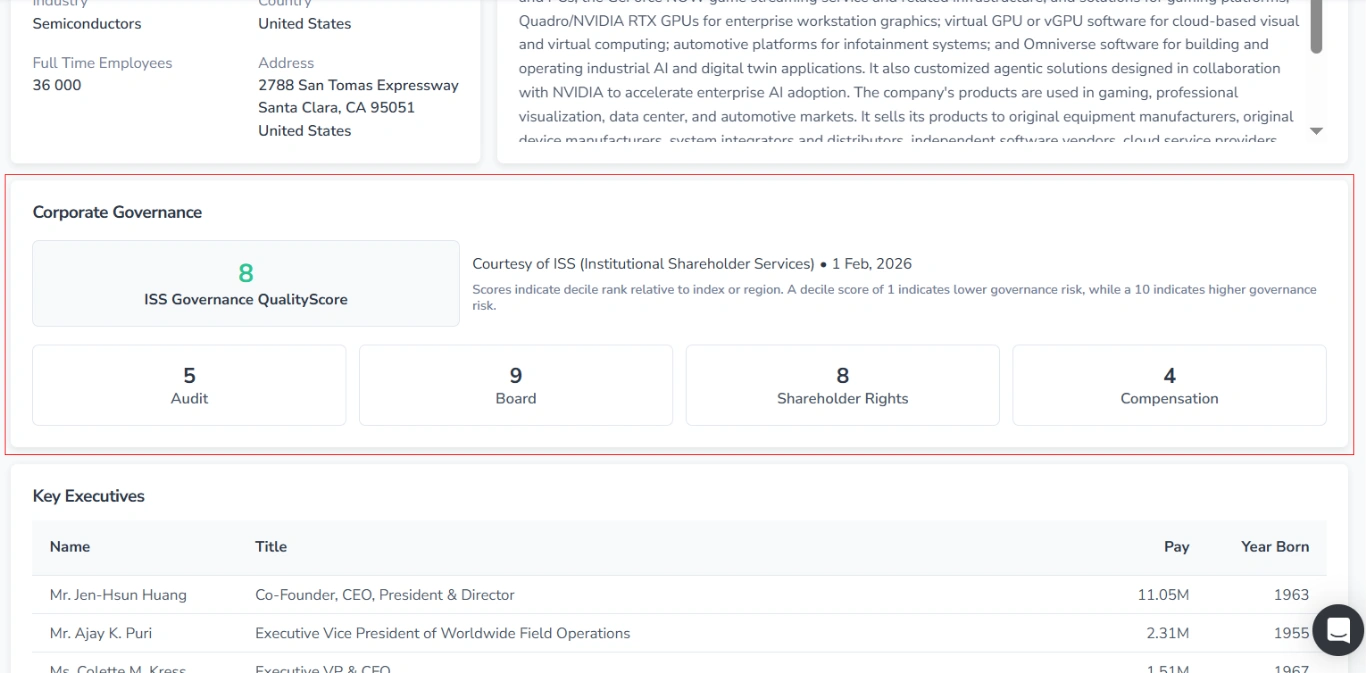
It includes the following elements:
- ISS Governance QualityScore and assessment details
- Subscores (audit, board, shareholder rights, and compensation)
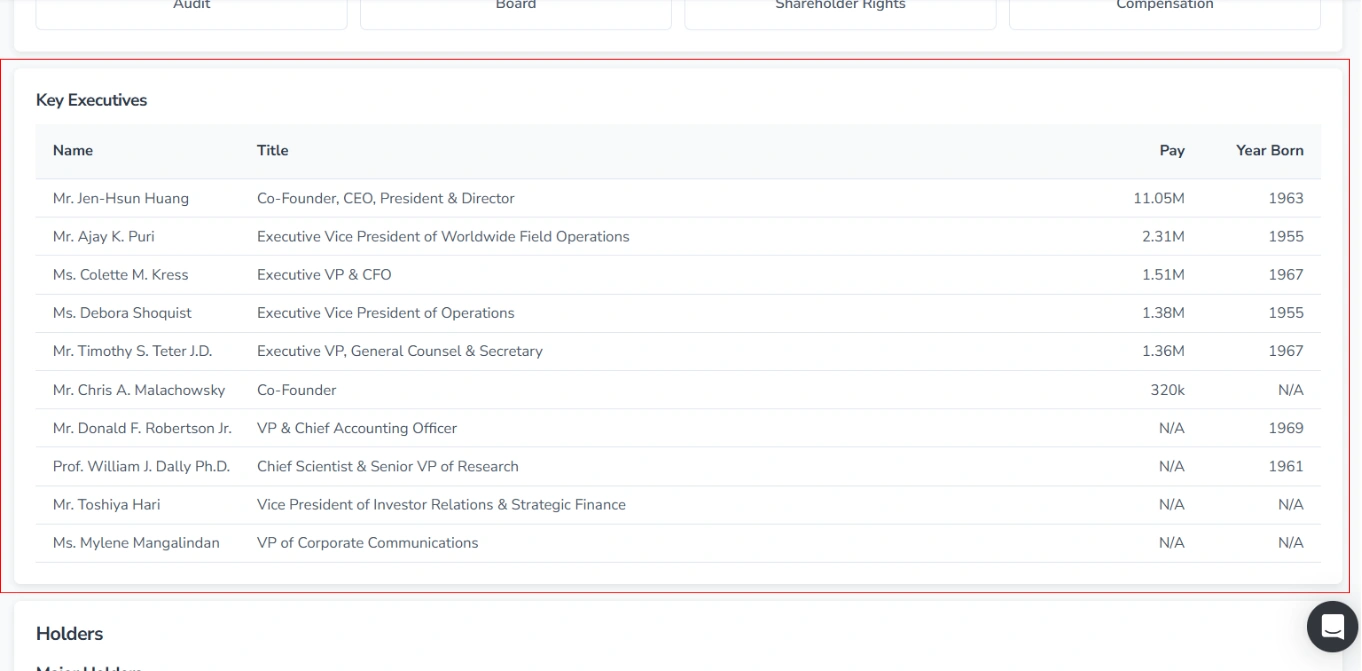
1.4. Key Executives
A table listing key executives, including their names, job titles, pay, and year of birth.
1.5. Holders
This section describes the company’s ownership structure.
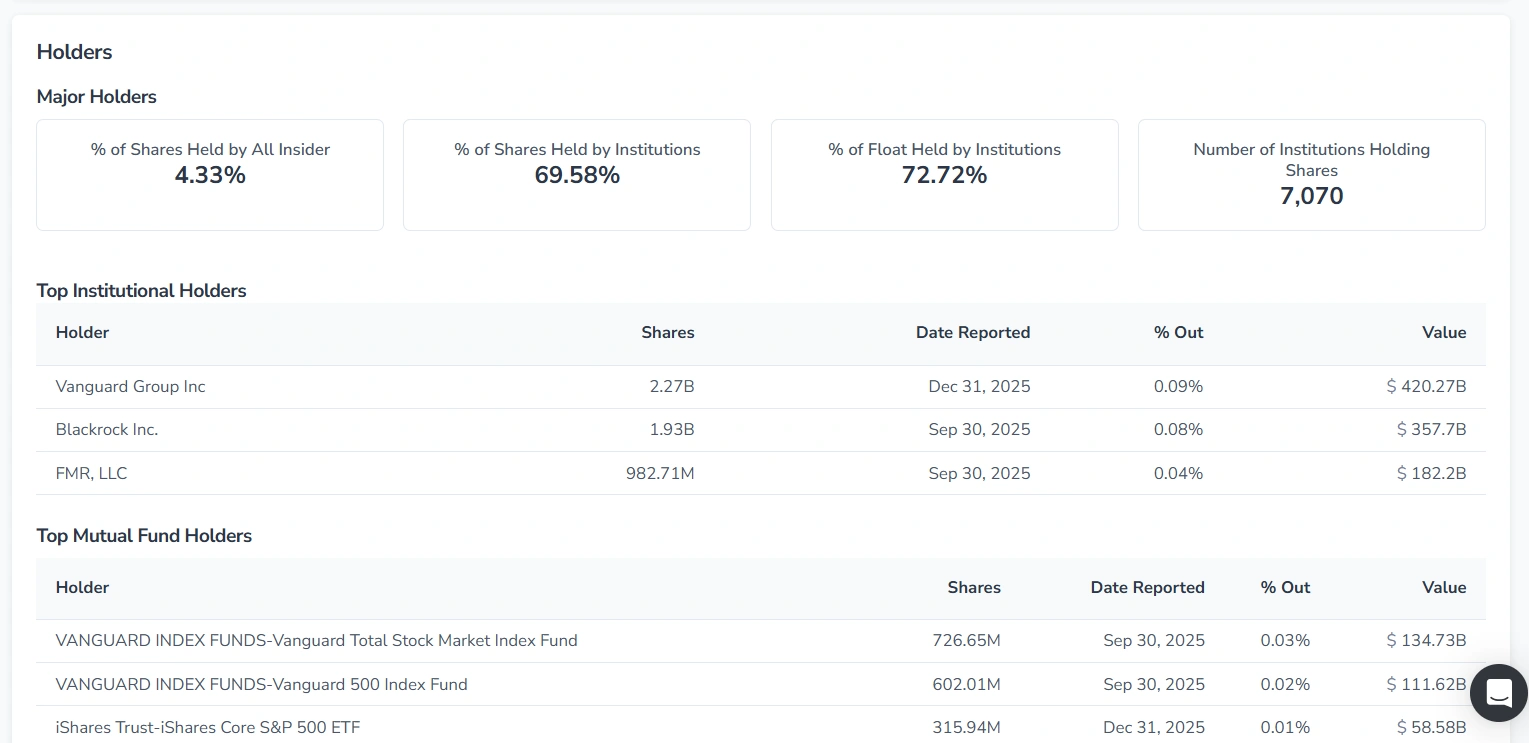
It includes the following blocks and tables:
- Major Holders
- Top Institutional Holders
- Top Mutual Fund Holders
- Insider Roster
- Insider Purchases – Last 6 Months
- Insider Transactions Reported – Last Two Years
2. Profile Tab Content for ETFs
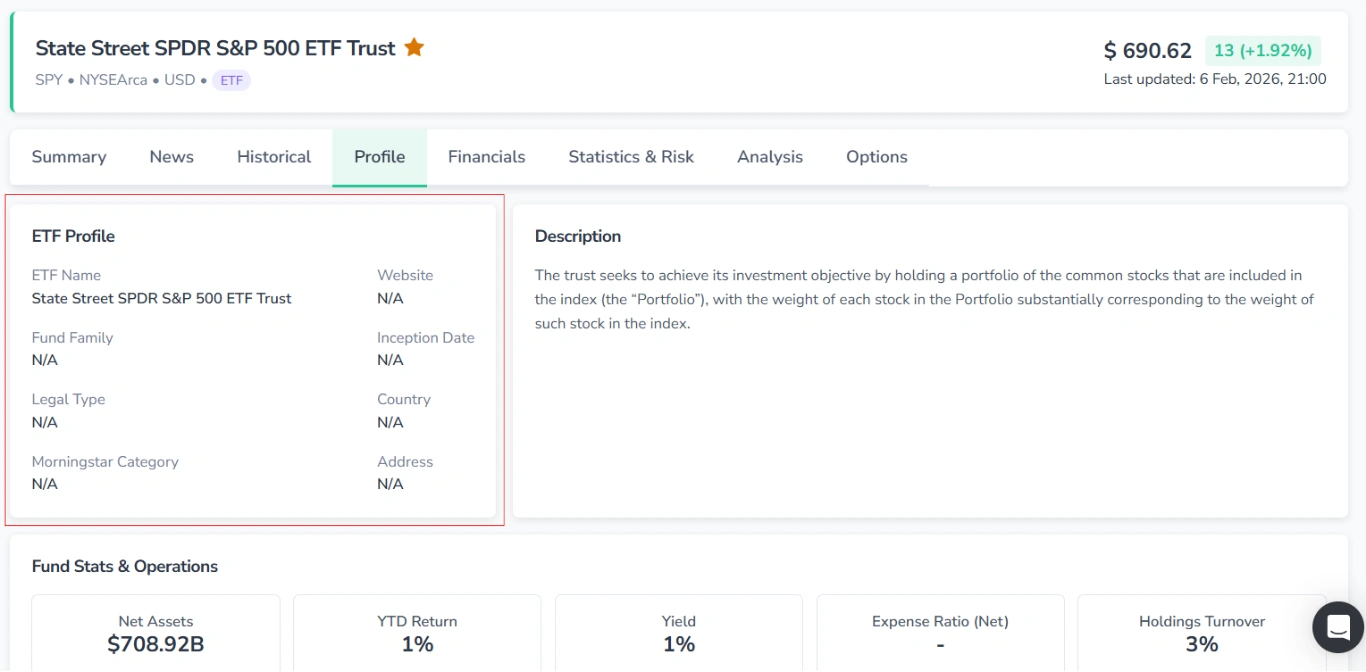
2.1. ETF Profile
Here, the main information about the ETF is presented.
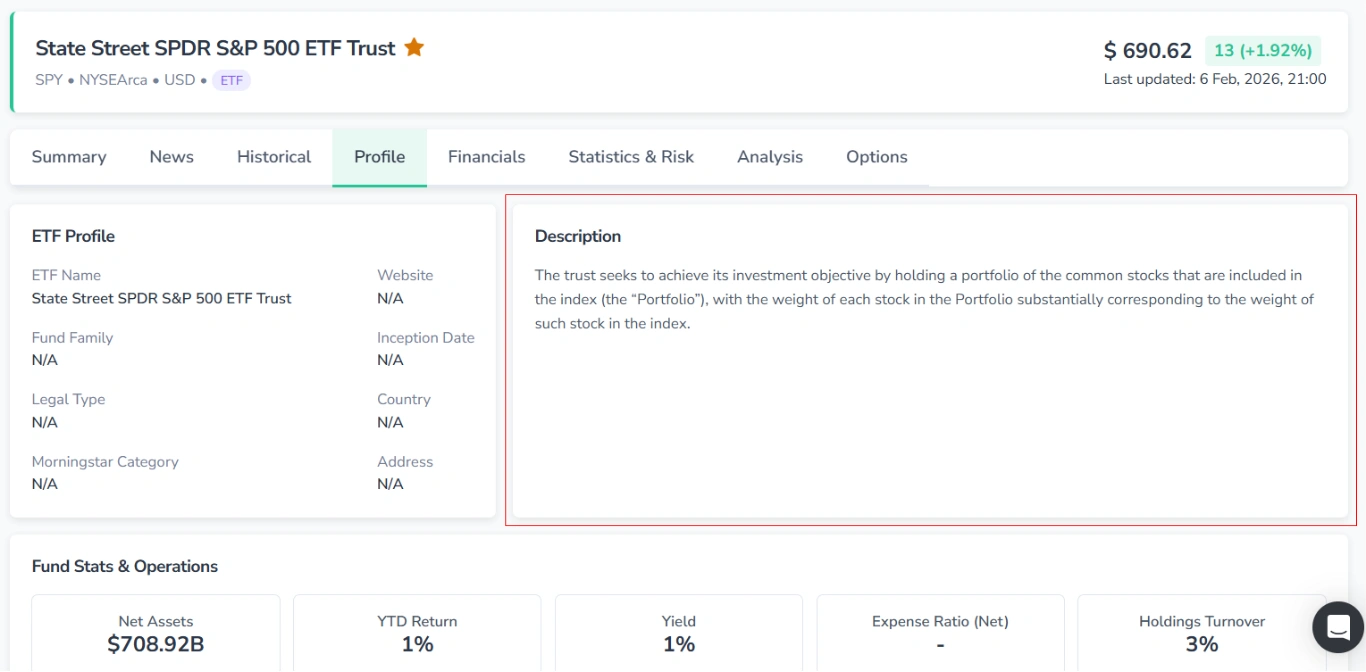
2.2. Description
A detailed text block describing the ETF’s investment objective and strategy.
2.3. Fund Stats & Operations
Here, the core fund statistics are displayed as cards, with key metrics compared against the category average.
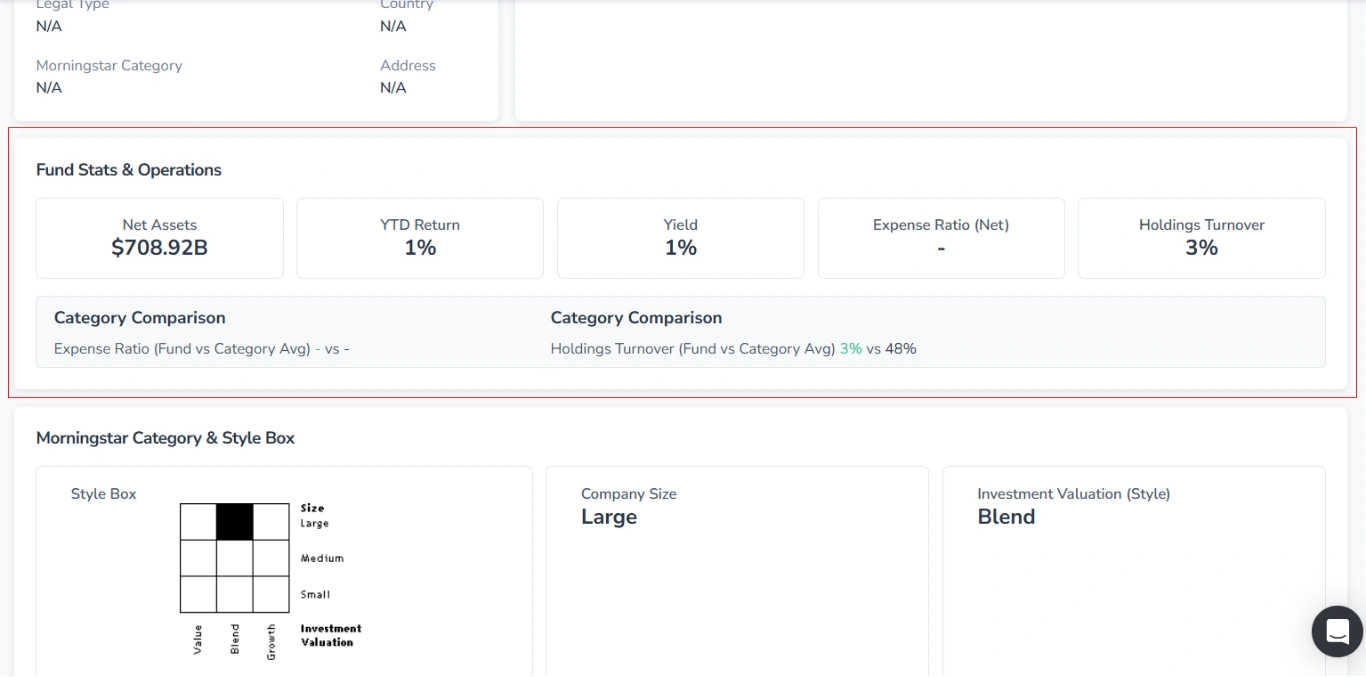
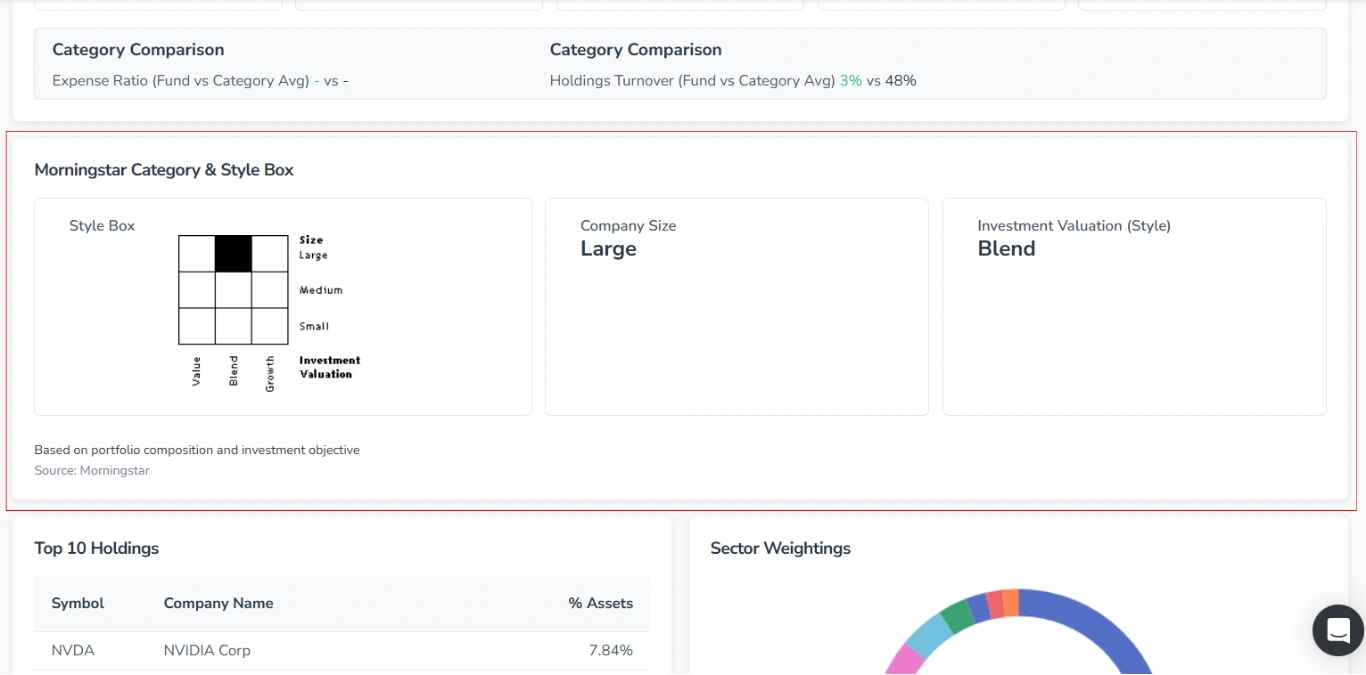
2.4. Morningstar Category & Style Box
This section displays the ETF’s Style Box with three cards.
2.5. Top 10 Holdings
The table of the ETF’s largest holdings.
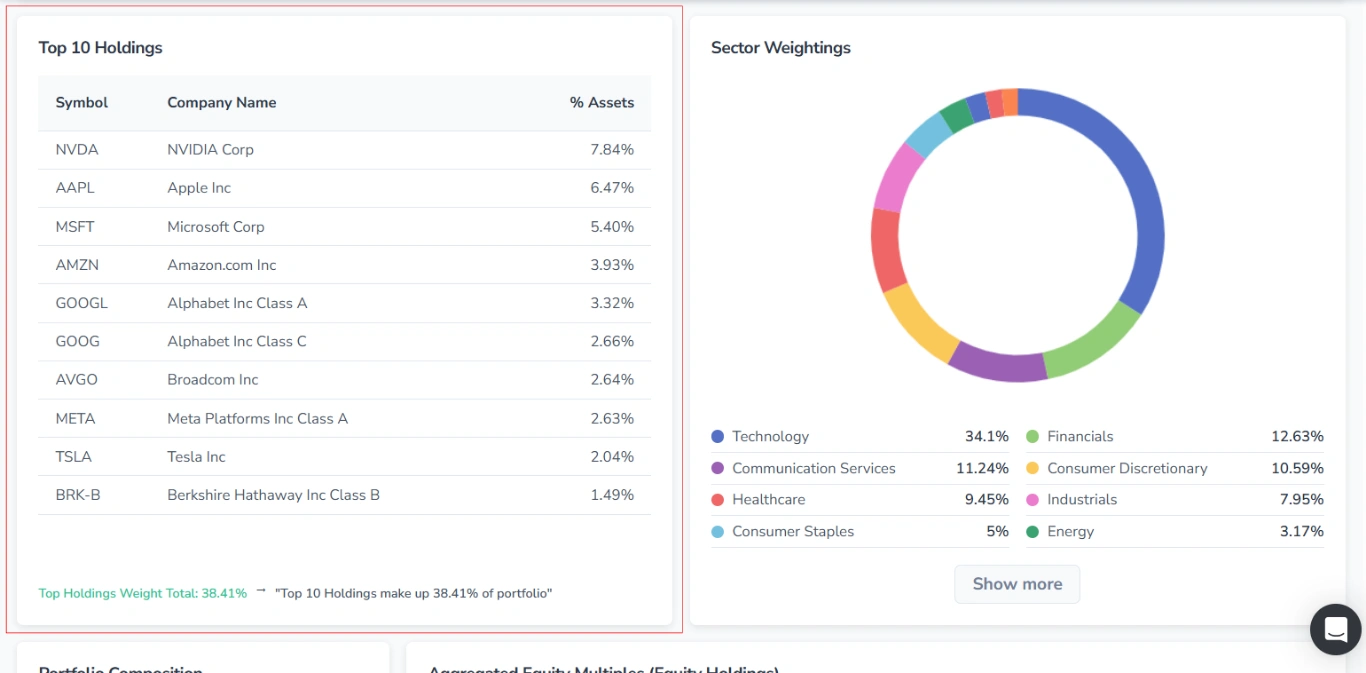
A summary statement beneath the table indicates the total weight of the top holdings (e.g., “Top 10 Holdings make up 39.63% of the portfolio”).
2.6. Sector Weightings
This section displays the percentage of the ETF’s assets allocated to each sector (e.g., Technology, Financials, Healthcare).
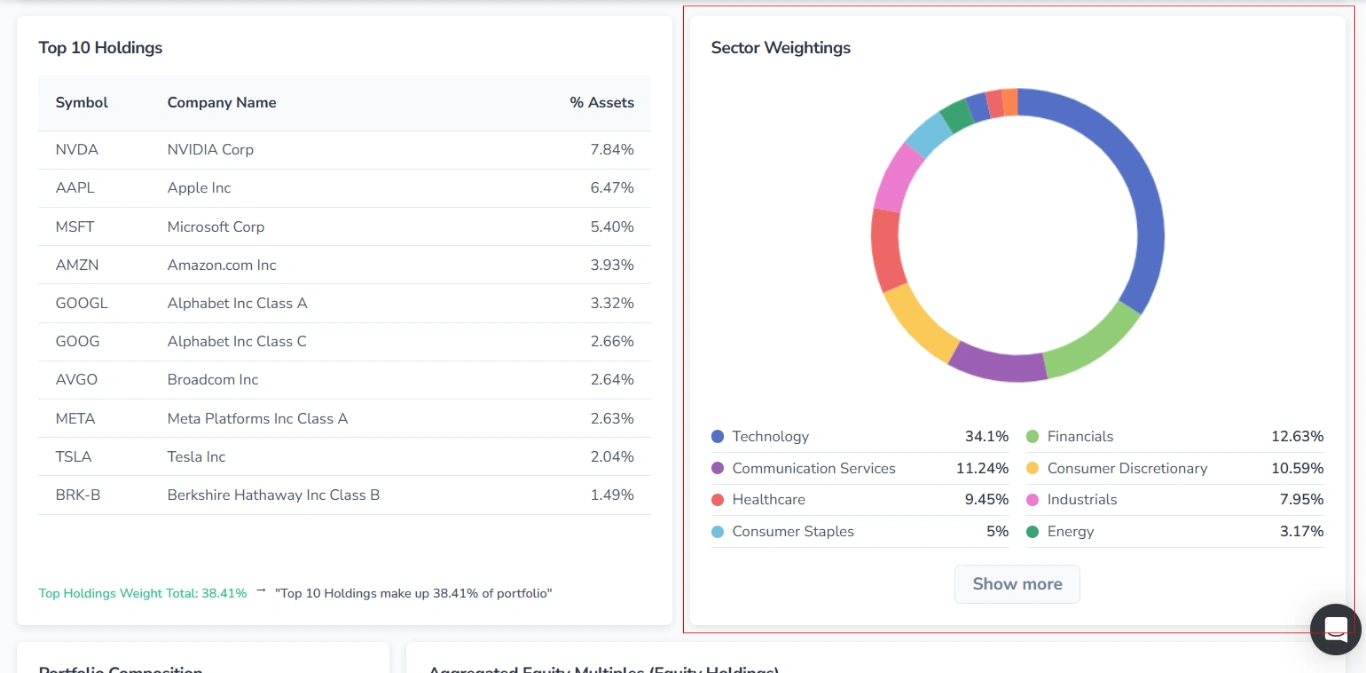
The allocation is visualized as an interactive donut chart, where each sector is represented by a distinct color. Hovering over a colored segment of the chart reveals the corresponding sector name and its percentage.
Below the chart, sectors are listed in descending order of weight.
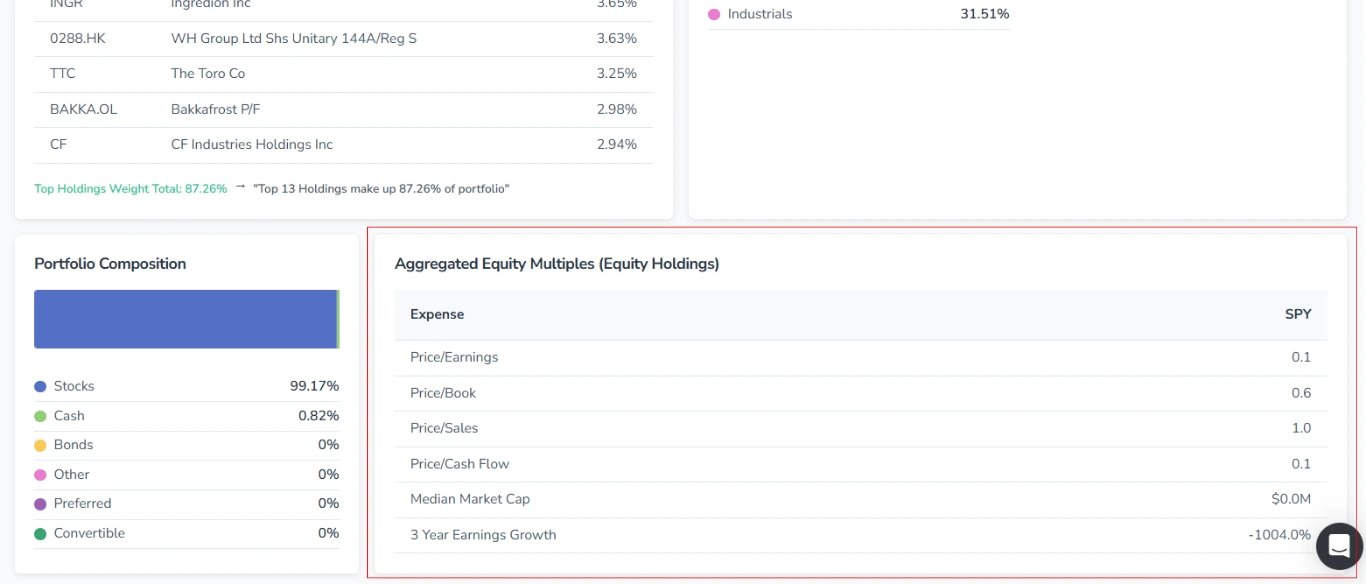
2.7. Portfolio Composition
This section visually represents the ETF’s asset allocation by type as an interactive horizontal bar chart, with each asset type assigned a distinct color. Hovering over a colored segment of the bar reveals the corresponding asset type and its percentage next to the cursor.
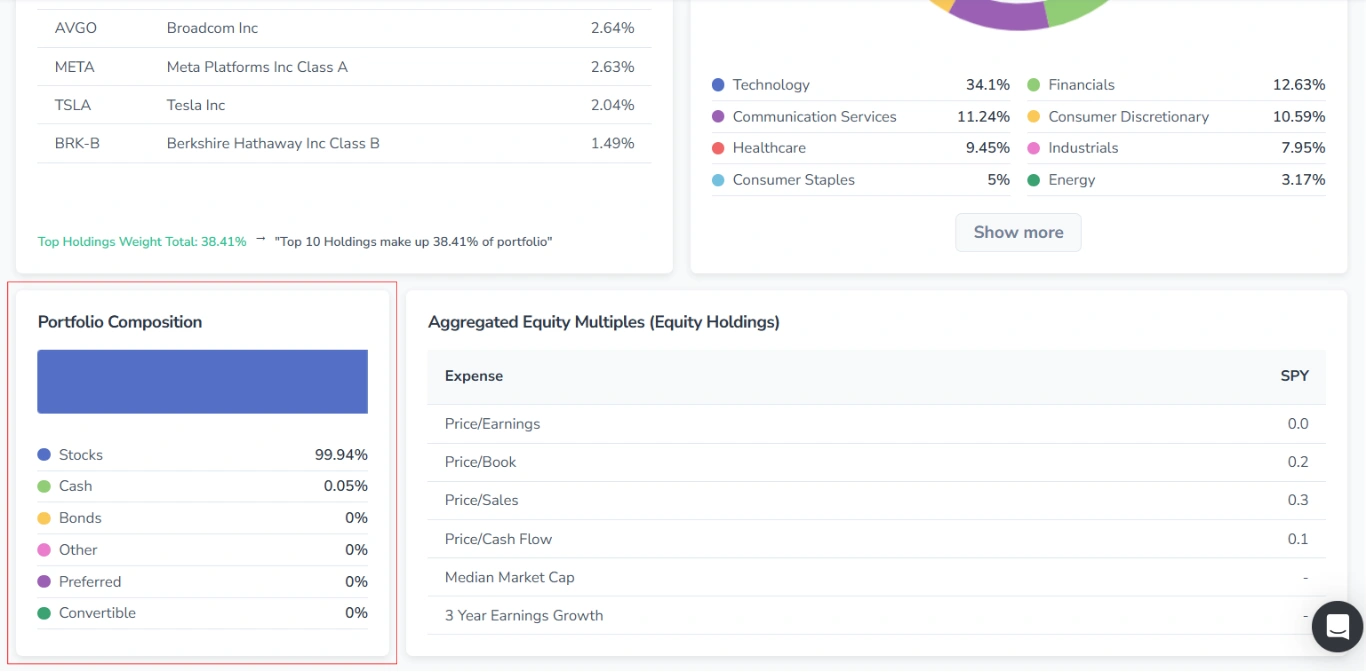
Below the bar, all asset types are listed with a colored dot, their name, and percentage value.
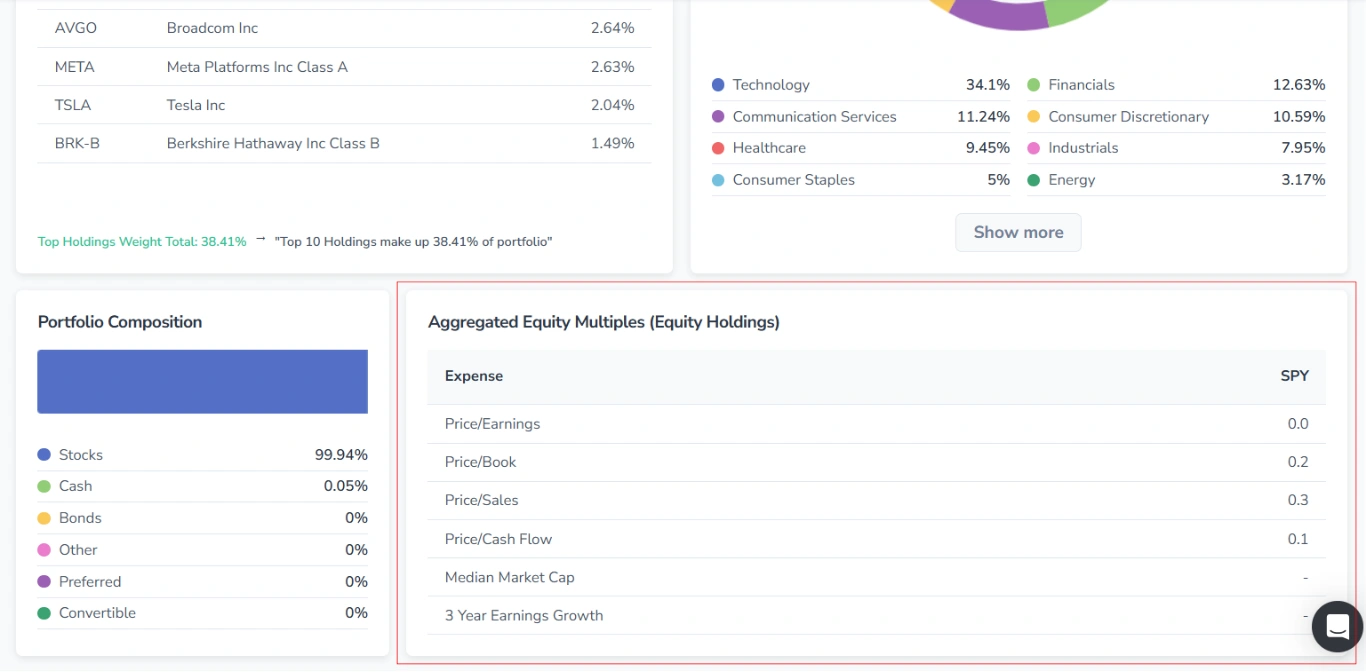
2.8. Aggregated Equity Multiples (Equity Holdings)
Here you can view key valuation metrics for the fund’s equity holdings in a table.
3. Profile Tab Content for Mutual Funds
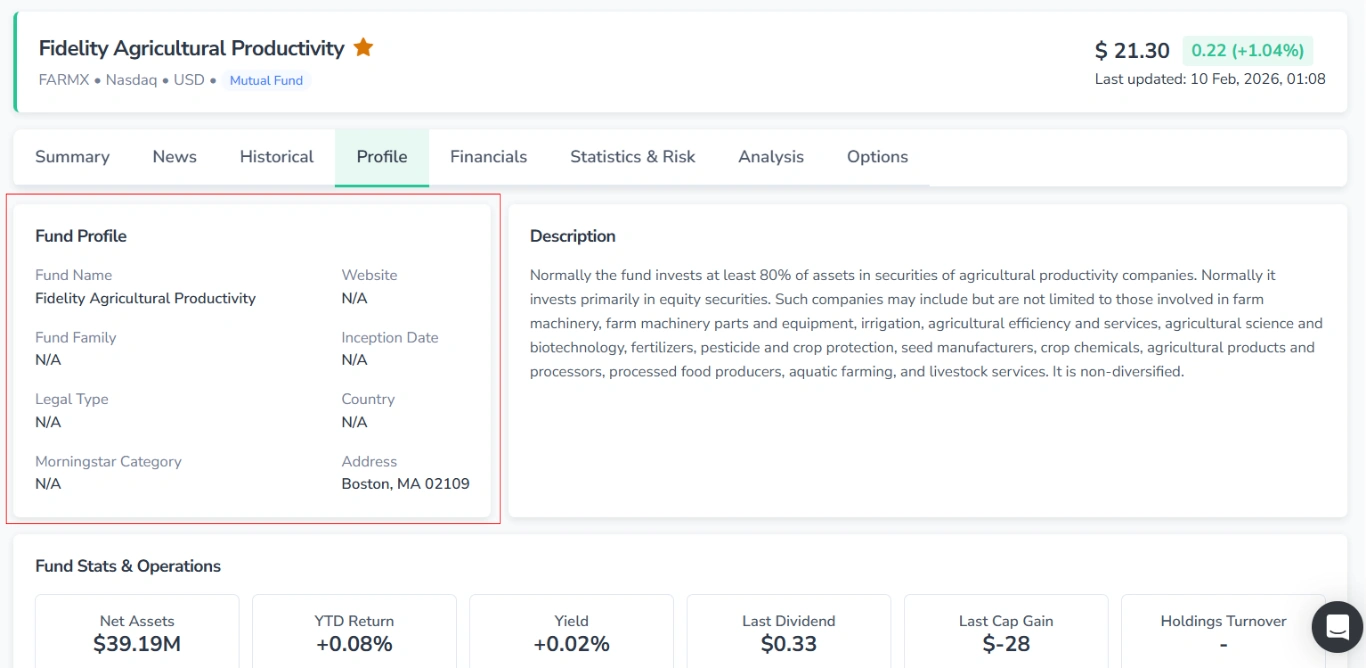
3.1. Fund Profile
This section presents the main information about the fund.
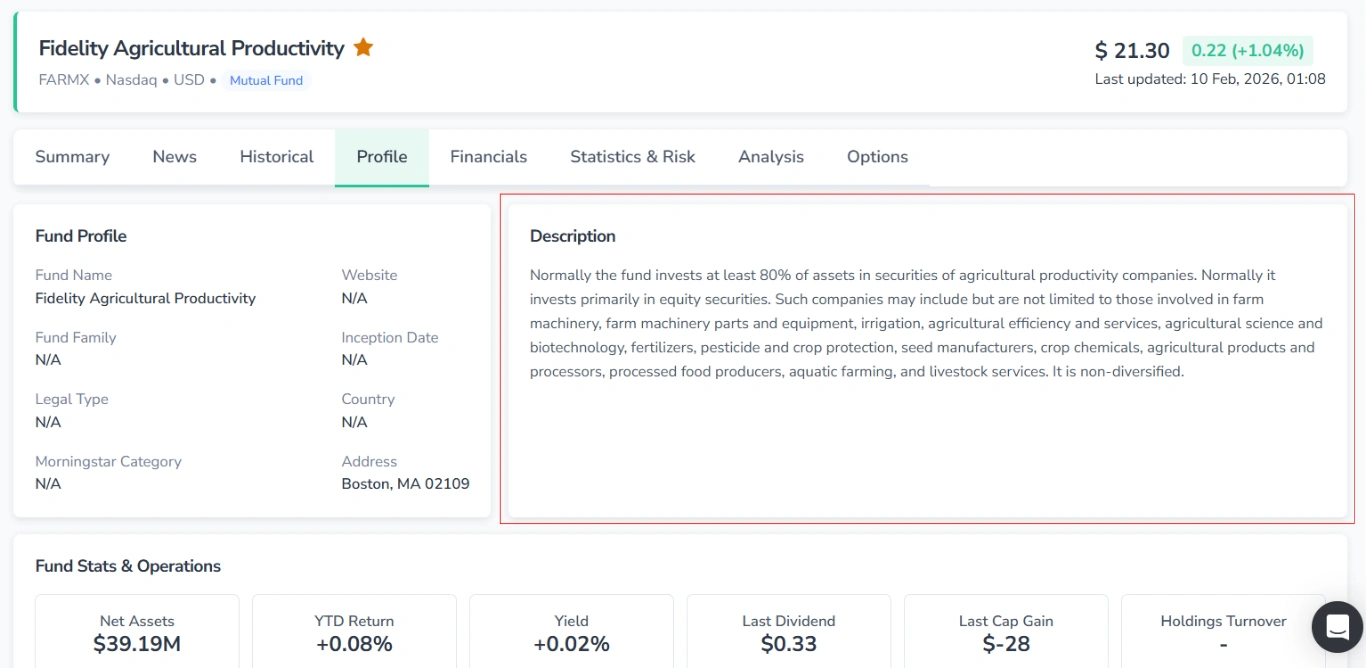
3.2. Description
A detailed text block describing the fund’s investment strategy, objectives, and typical holdings.
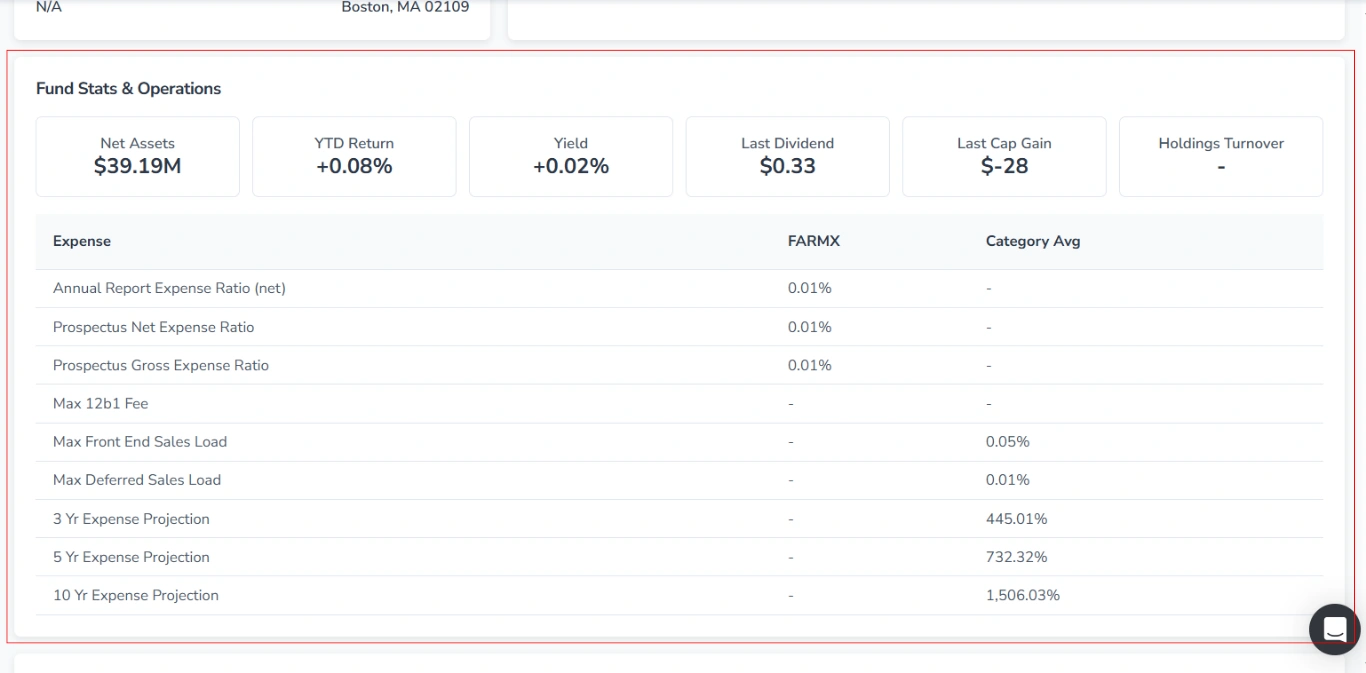
3.3. Fund Stats & Operations
In this section, core fund statistics appear as cards, with additional operational and expense metrics shown in a table.
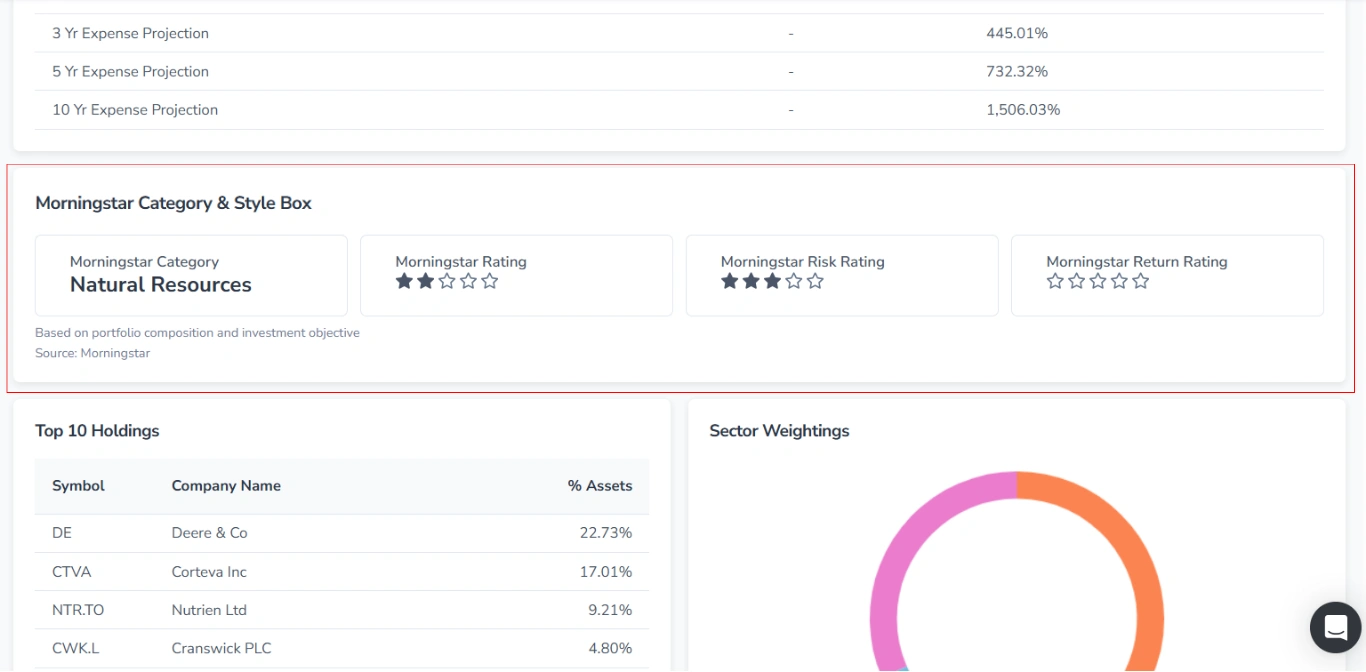
3.4. Morningstar Category & Style Box
Here, you can view the fund’s category and ratings, presented in four cards.
3.5. Top 10 Holdings
This section lists the fund’s ten largest holdings in a table, with a summary statement below (e.g., “Top 10 Holdings make up 81.74% of the portfolio”).
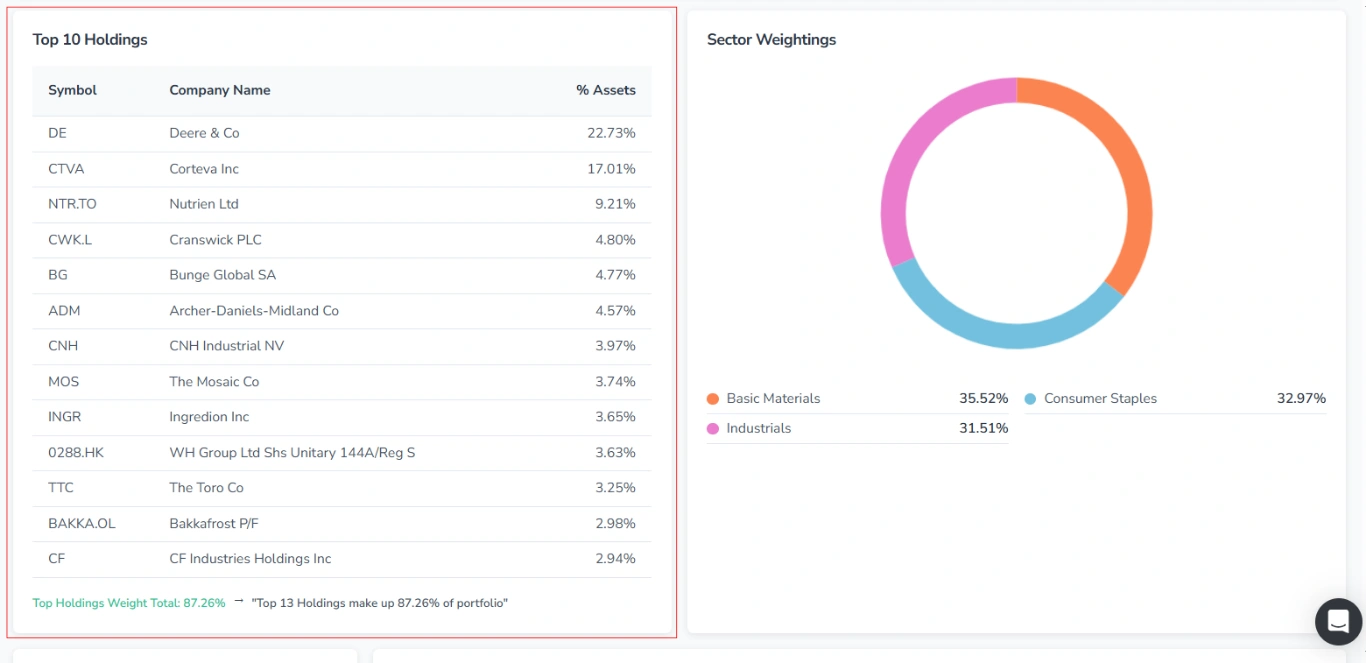
3.6. Sector Weightings
Here you can view the percentage of fund assets allocated to each sector (e.g., Basic Materials, Industrials, Consumer Defensive).
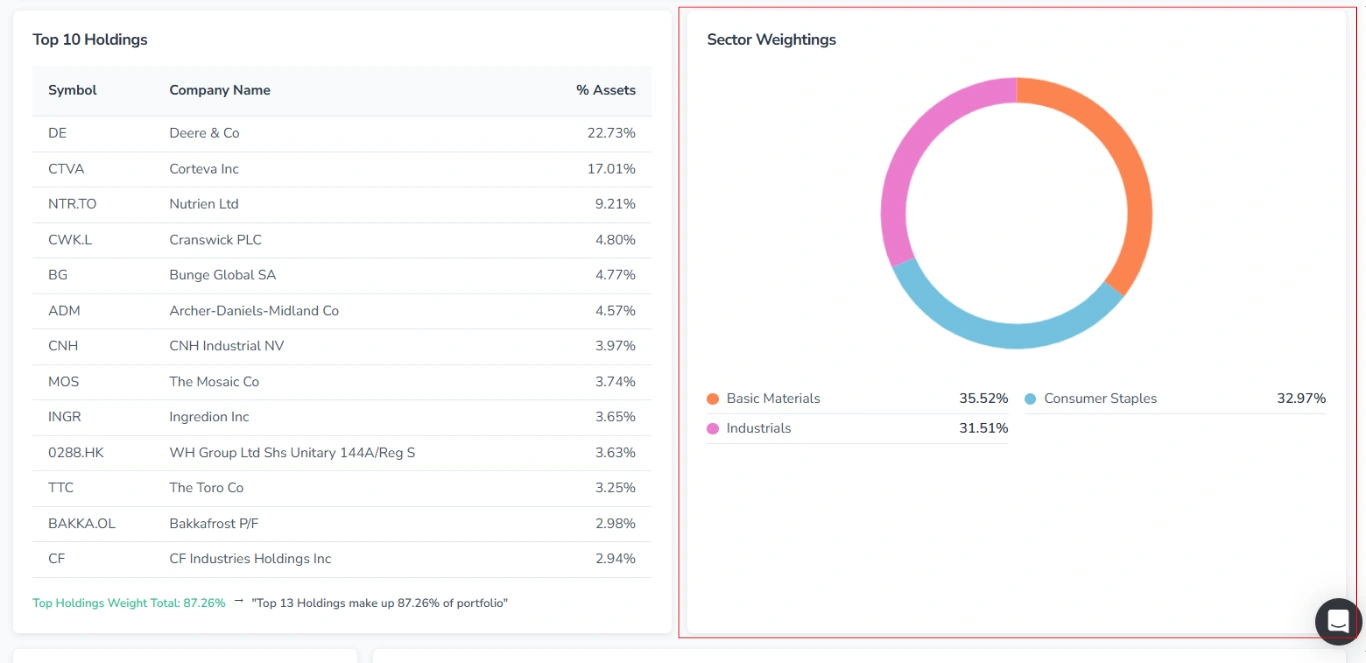
The allocation is displayed as an interactive donut chart, with each sector shown in a distinct color. Hovering over a colored segment of the chart reveals the corresponding sector and its percentage next to the cursor.
Below the chart, sectors are listed in descending order of weight.
3.7. Portfolio Composition
This section shows the allocation of fund assets by type.

It is represented as an interactive horizontal bar, with each asset type assigned a distinct color and proportionally represented on the scale. Hovering over a colored segment of the bar reveals the corresponding asset type and its percentage next to the cursor.
Below the scale, each type is listed with a colored dot, its name, and the percentage value.
3.8. Aggregated Equity Multiples (Equity Holdings)
This block presents key valuation metrics for the fund’s equity holdings in a table.