The Analysis tab contains earnings data, analyst estimates, price targets, and revision history for the selected ticker. It includes the following sections:
- Earnings Per Share (EPS): Historical EPS actuals and estimates by quarter. The chart is available in both line and bar views.
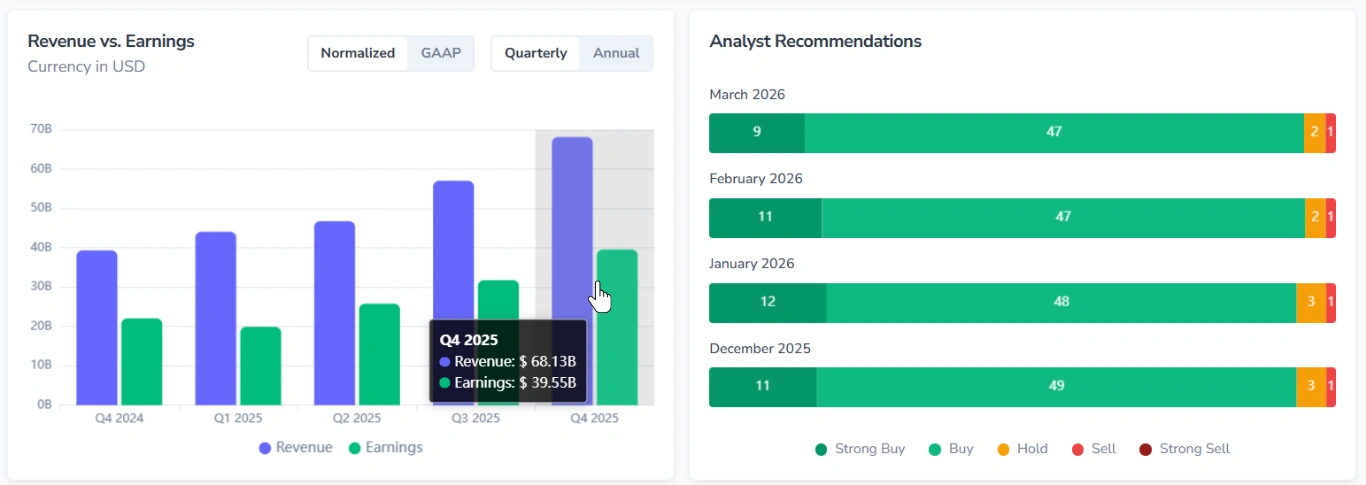
- Revenue vs. Earnings: A comparison of revenue and earnings figures (by quarter/annually).
- Analyst Recommendations: Distribution of analyst ratings.
- Analyst Price Targets: A visual range of low, average, and high price targets relative to the current price.
- Earnings Estimate: Low, average, and high EPS estimates for upcoming quarters and fiscal years.
- Revenue Estimate: Low, average, and high revenue estimates for upcoming quarters and fiscal years.
- Growth Estimates: Projected growth figures for the selected ticker compared to the S&P 500.
- EPS Trend: Changes in consensus EPS estimates over the last 90 days.
- EPS Revisions: The number of upward and downward EPS estimate revisions (over the last 7 or 30 days).
- Top Analysts: A table of individual analyst ratings, scores, and price targets.
- Upgrades & Downgrades: A table of rating changes and price target actions over time.
1. Normalized and GAAP Data
The Earnings Per Share and Revenue vs. Earnings sections include a Normalized/GAAP toggle.
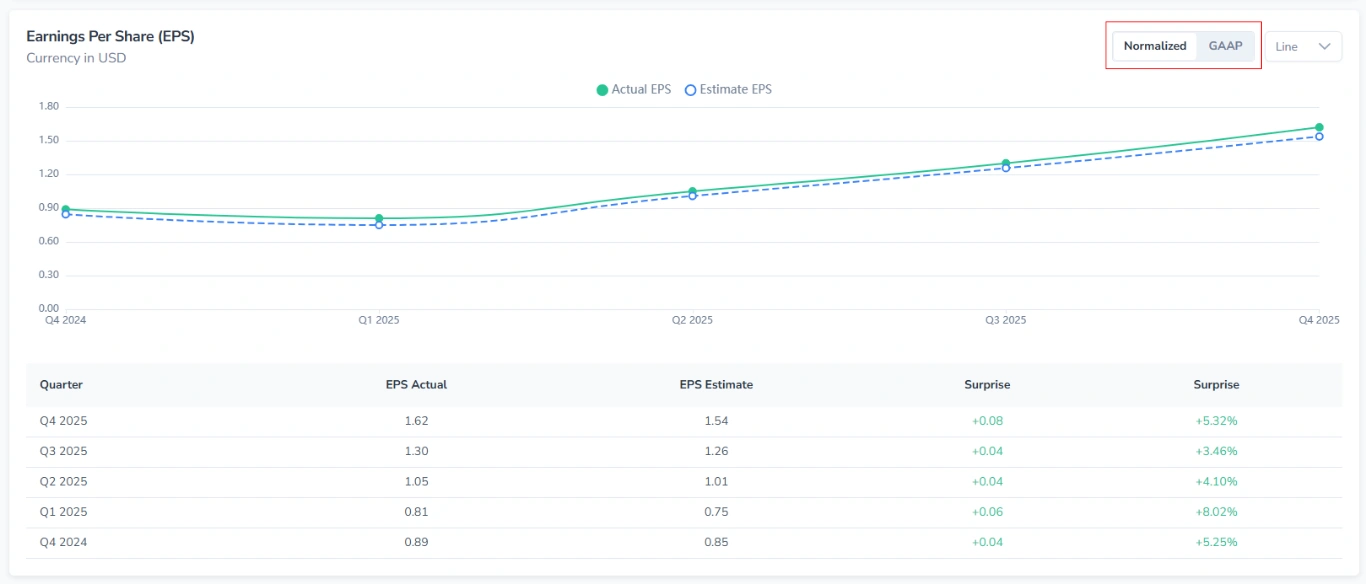
Use it to switch between reporting standards:
- GAAP figures follow standard accounting rules and include all items.
- Normalized figures exclude certain one-time or non-recurring adjustments.
2. Key Behaviors
All charts in the Analysis tab share the following interactive features:
2.1. Tooltip on Hover
Hovering over a data point or bar displays a tooltip with the exact values for that position.
2.2. Toggling Metrics
Each chart includes a legend with metric names and colored indicators.
- Press the metric name to remove the corresponding series from the chart.
- Press again to restore.