
Day Gainers & Losers: How to Spot Market Momentum with FinImpulse
A guide to analyzing daily gainers and losers to track short-term momentum.
Every day, some stocks surge while others tumble — and together, they tell a story about market sentiment. The Day Gainers and Day Losers screeners in FinImpulse help you capture that story in real time. They’re not just lists of “winners” and “losers,” but dynamic heatmaps of what’s driving the market right now.
What Are “Gainers” and “Losers”?
In financial terms, gainers are stocks that increased in price over the trading day, while losers are those that declined. But in practice, these two groups often reveal much more:
- Day Gainers point to rising optimism — momentum, positive earnings surprises, or sector breakouts.
- Day Losers often reflect short-term fear, correction after overvaluation, or market reaction to negative news.
Tracking these moves helps investors and analysts understand where the capital is flowing — and where opportunities may emerge next.
Inside the FinImpulse Screener
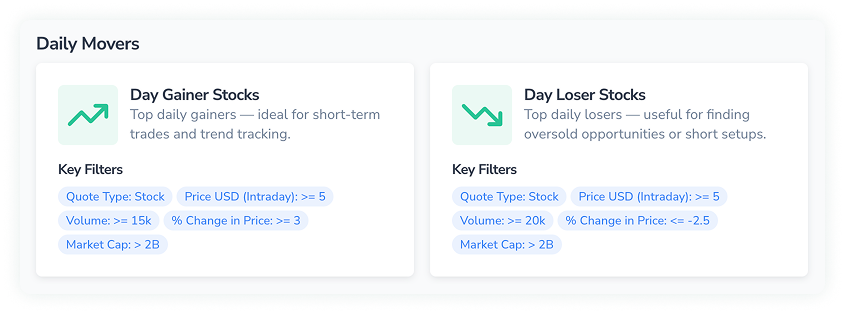
FinImpulse automatically scans thousands of global tickers and filters them using pre-set rules:
- Quote Type: Stock
- Market Cap: > 2B
- Price (Intraday): ≥ $5
- Volume: ≥ 15K (gainers) / ≥ 20K (losers)
- % Change in Price: ≥ +3% (gainers) / ≤ −2.5% (losers)
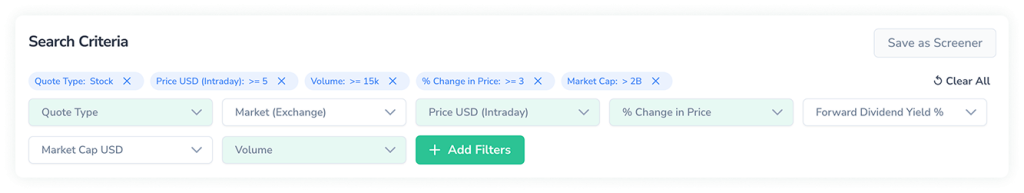
But that’s just the starting point. You can add your own filters — for example:
- Limit the results to Japan, Australia, or Canada
- Focus on a specific sector (Technology, Energy, Healthcare)
- Combine with Dividend Yield, 52W Range, or P/E ratio and instantly see which companies match your custom setup.
You can also add or rearrange columns — from returns and volatility to trading averages, volume, and market cap — to tailor the screener to your own strategy.
How to Read the Numbers
Let’s take a closer look at what matters when analyzing these lists.
If you’re watching Day Gainers:
Focus on:
- % Change in Price (Ch 1D) — the key metric for daily momentum. A rise above +5% often signals strong bullish sentiment.
- Volume — confirm that the move is backed by liquidity. Spikes in volume (greater than 2 times the average) usually indicate institutional interest.
- 52W Range — check if the stock is breaking near its yearly high. That may confirm a trend continuation.
- Returns (1Y, 3Y) — see if today’s gain fits a long-term growth story or looks like a short squeeze.
Example:
NVIDIA (+4.2%) and AMD (+3.6%) rally after earnings. Both show volumes 3× above average — suggesting the move is driven by fundamentals, not speculation.
If you’re watching Day Losers:
Pay attention to:
- % Change in Price (Ch 1D) — sharp declines beyond −5% can mark panic or profit-taking.
- Volume spikes — high volume on a drop often indicates that large players are exiting positions.
- 50D / 200D averages — if price crosses below long-term averages, that can indicate trend reversal.
- Dividends & Returns — strong fundamentals but temporary decline? That’s where value investors look for entry points.
Risk note: Stocks from the Losers list may remain under pressure due to unresolved issues or negative trends. Even value investors should analyze the causes of the decline and not rely solely on fundamentals.

Example:
Tesla (−5.1%) appears among Losers after disappointing delivery numbers, but its fundamentals remain intact — a potential opportunity for medium-term investors.
Who Benefits from These Insights
- Active traders use Day Gainers to ride short-term momentum and set intraday alerts.
- Value investors monitor Day Losers to find quality companies temporarily oversold.
- Portfolio managers track sector distribution — e.g., if energy or tech dominate gainers, it’s a sign of capital rotation.
- Analysts and researchers integrate screener data into daily briefings or automated dashboards.
Why It Matters
The Gainers/Losers view is the market’s pulse. It helps you:
- Detect sentiment shifts early
- Identify high-impact events behind price moves
- Spot correlations between global markets (e.g., tech drop in the US → ripple effect in Asia)
- Build or backtest short-term trading strategies
FinImpulse turns this complexity into clarity — a fast, customizable window into what’s moving right now.
Try It Yourself
Explore the Daily Movers screener in FinImpulse. Adjust filters, add your own markets, save your setup — and start seeing the market in motion, not in hindsight.