Skip to content
FinImpulseFinImpulse
    • Investor Dashboard
    • Financial Data APIs
    • Dashboard Pricing
    • API Pricing
  • Articles
    • API Documentation
    • User Manual
    • FAQs
    • Glossary
  • Contact
Sign In Try for Free

Tag: 52-Week Highs

  • All
  • Market & Investing Insights 5
  • Metrics & Fundamentals 6
Chart with rising bars, a price arrow and a dashed line marking 52-Week High and 52-Week Low levels
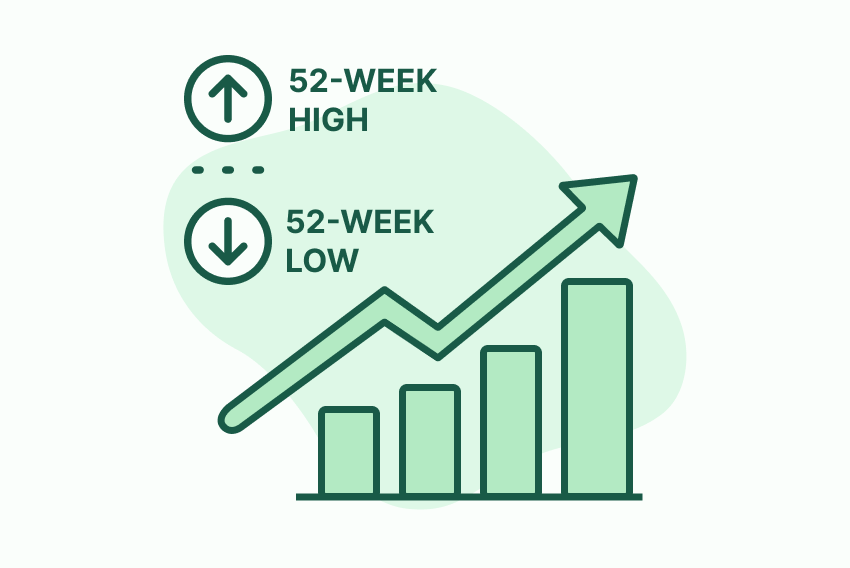
Market & Investing Insights

52-Week Highs & Lows: Understanding Market Momentum and Value Signals

A breakdown of how 52-week levels reveal both momentum and valuation opportunities.
November 25, 2025 Read More
Finimpulse logo
Global market data and analytics platform for investors and developers.
Veselka Technologies FZCO
Building A1, Dubai Digital Park
Dubai Silicon Oasis, Dubai
United Arab Emirates
Products
  • Investor Dashboard
  • Dashboard Pricing
  • Financial Data APIs
  • API Pricing
Resources
  • Articles
  • API Documentation
  • User Manual
  • FAQs
  • Glossary
Company
  • Contact Us
  • Privacy Policy
  • Terms of Service

© 2026 FinImpulse. All Rights Reserved.

We value your privacy

We use cookies to ensure the proper functioning of the platform, analyze usage, and improve our services.

By clicking "Accept All", you agree to our use of cookies as described in our Privacy Policy and Terms of Service.