How to Find Energy Stocks Worth Watching: A Practical Screening Flow
A practical guide on how to find energy stocks using five filters and the result explained.

Global energy markets are under pressure — supply routes are strained, oil prices are climbing, and energy equities are moving with them. The sector is large, data is abundant, and the relationship between commodity prices and stock performance is relatively direct. That makes it a natural starting point for systematic screening.
FinImpulse currently covers 4,500+ energy-related tickers across global markets. The question is which energy stocks are worth analyzing — and how do you find them?
This article walks through one practical filtering flow — from the universe of energy tickers to a focused, analyzable list.
Building the Filter Stack
First, set the sector to Energy. From here, add filters in sequence — each one narrowing the list with a specific purpose:
- Market Cap USD > $10B: Removes smaller, less stable companies. What remains are established players with institutional coverage and sufficient data depth.
- Avg Volume (3-Month) > 1M: Filters out illiquid names. At this threshold, you’re working with assets that actually trade — tighter spreads, more reliable price signals.
- Forward Dividend Yield > 3%: Keeps companies generating consistent cash returns. For energy, 3% is a reasonable baseline — the sector has historically been income-driven, and yield is a proxy for financial stability.
- 1-Year Return > 10%: Removes underperformers. Names that haven’t moved with the broader energy cycle over the past year are excluded here.
- Change vs. 200-Day Average > 0%: Confirms the long-term trend is still positive. Any name already trading below its 200-day average is in structural decline relative to its own history — a flag worth filtering out at this stage.
After applying all five filters, the list drops from thousands to a manageable set of 70 stocks.
What the Results Reveal
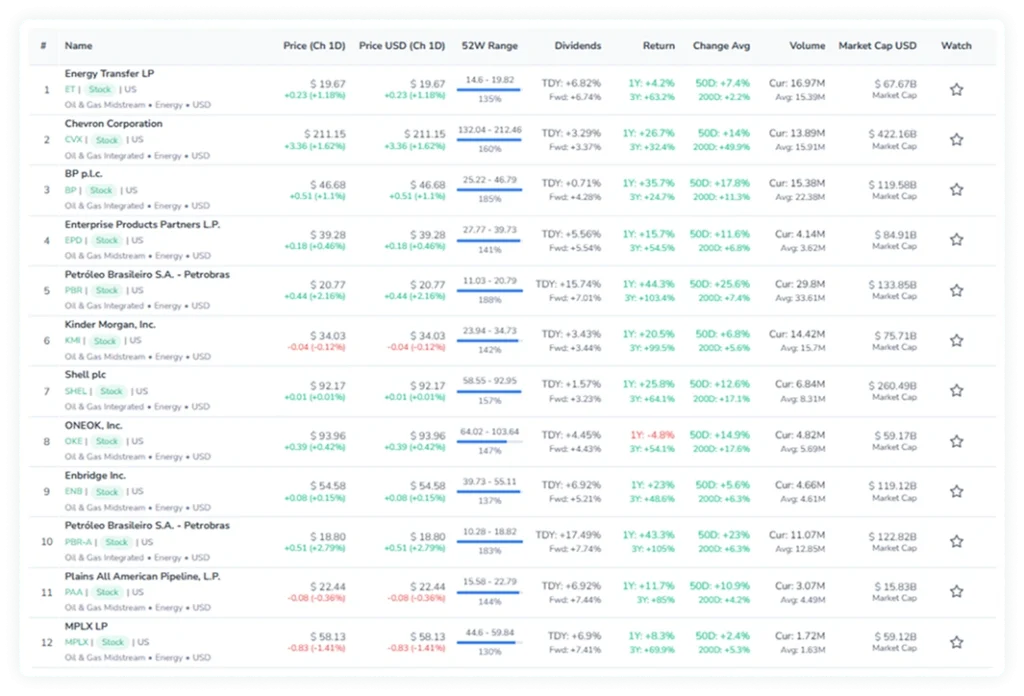
The filtered list spans multiple regions, but the names don’t distribute evenly. Three distinct profiles emerge: stable Western majors built for yield, higher-performance names with additional country risk, and large-cap players where scale doesn’t translate into momentum. Here’s how each breaks down.
Western Majors
The list is anchored by large integrated companies from the US, Canada, and Europe — Chevron, Shell, TotalEnergies, Enbridge. This is exactly what the filters select for: established players with consistent dividends, deep liquidity, and broad institutional coverage.
Latin America
Petrobras clears the dividend threshold with a forward yield in the 7–8%+ range — well above the Western average. The yield profile is notably higher, but it comes with a different risk layer: political exposure and capital allocation decisions that don’t follow the same patterns as Western majors.
Asia and the Middle East
PetroChina and CNOOC show strong 1-year performance, but the 200-day filter catches some of them — trend momentum is less consistent than in Western counterparts. Saudi Aramco sits at the other end: massive market cap, stable yield, but nearly flat 1-year return. Scale is there; momentum isn’t.
Beyond regional differences, two patterns hold across the entire list. Most names are trading near their 52-week highs — the sector has already repriced, and energy is not an overlooked sector at this point. And dividends are consistent: the majority of names fall into the 3–5% yield range, confirming the sector’s income-driven character.
Wrapping Up
Five sequential filters brought a universe of 4,500+ tickers down to 70 analyzable names — with a clear picture of where the energy sector stands today. That’s the practical value of structured filtering: a defined logic applied to raw market data, step by step.
The same approach works across any sector or criteria set. Replicate this flow in FinImpulse, or build your own — the dashboard supports 50+ filters across price, volume, dividends, price performance, and technical indicators.
Access is free to start.