
The Summary tab provides an at-a-glance view of essential information about the selected ticker. Its contents vary depending on the asset type (Stock/ETF/Mutual Fund).
1. Summary Tab Content for Stocks
1.1. Price Chart
A chart that provides a visual illustration of price movement over the past 30 days for informational purposes.

1.2. Price & Volume Table
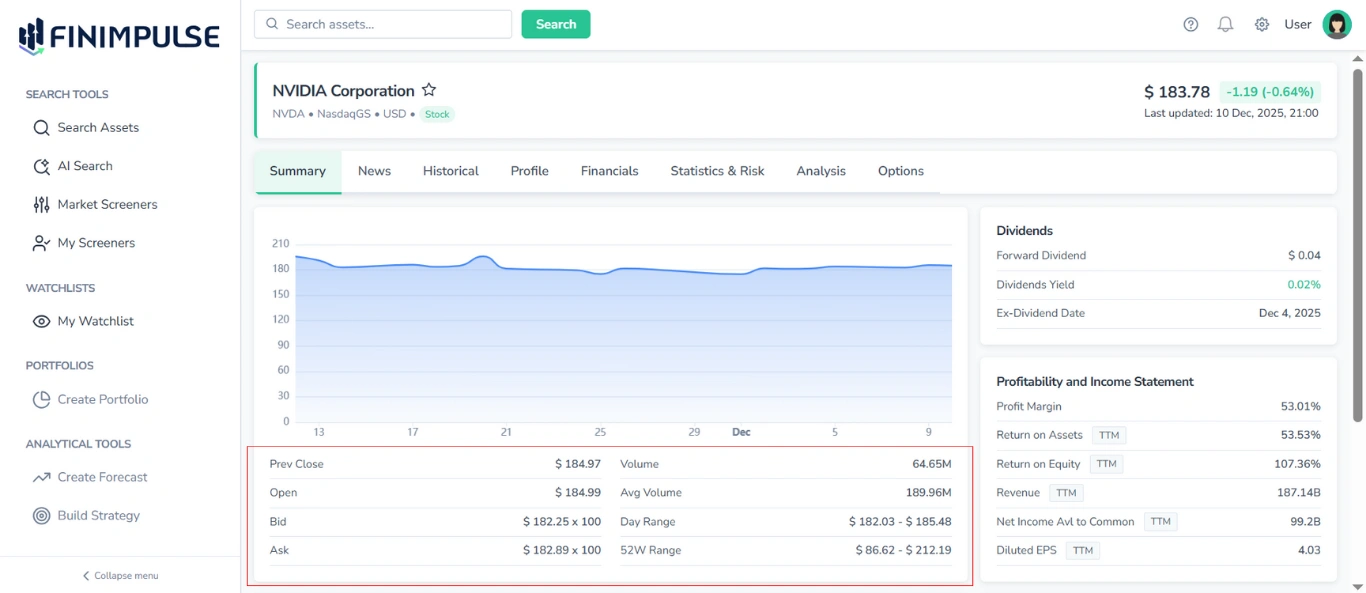
Located under the Price Chart, this table shows:
- Prev Close
- Open
- Bid / Ask
- Day Range
- 52W Range
- Volume
- Average Volume
1.3. Dividends Table
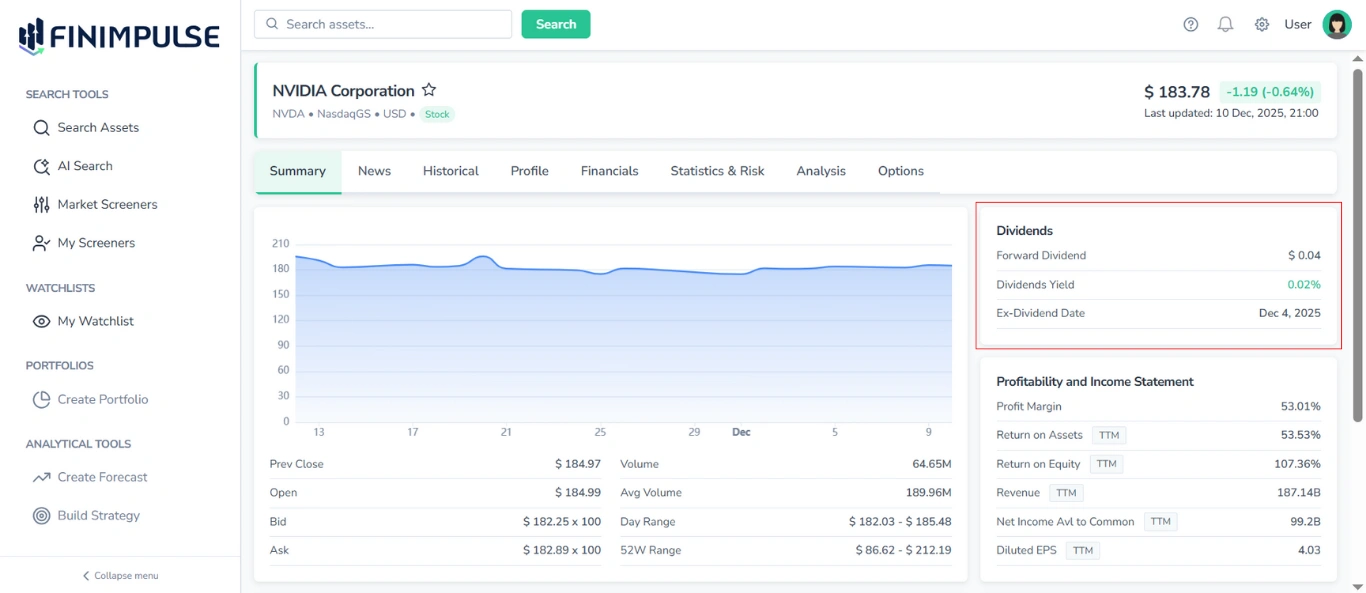
It shows:
- Forward Dividend
- Dividend Yield
- Ex-Dividend Date
1.4. Profitability and Income Statement Table
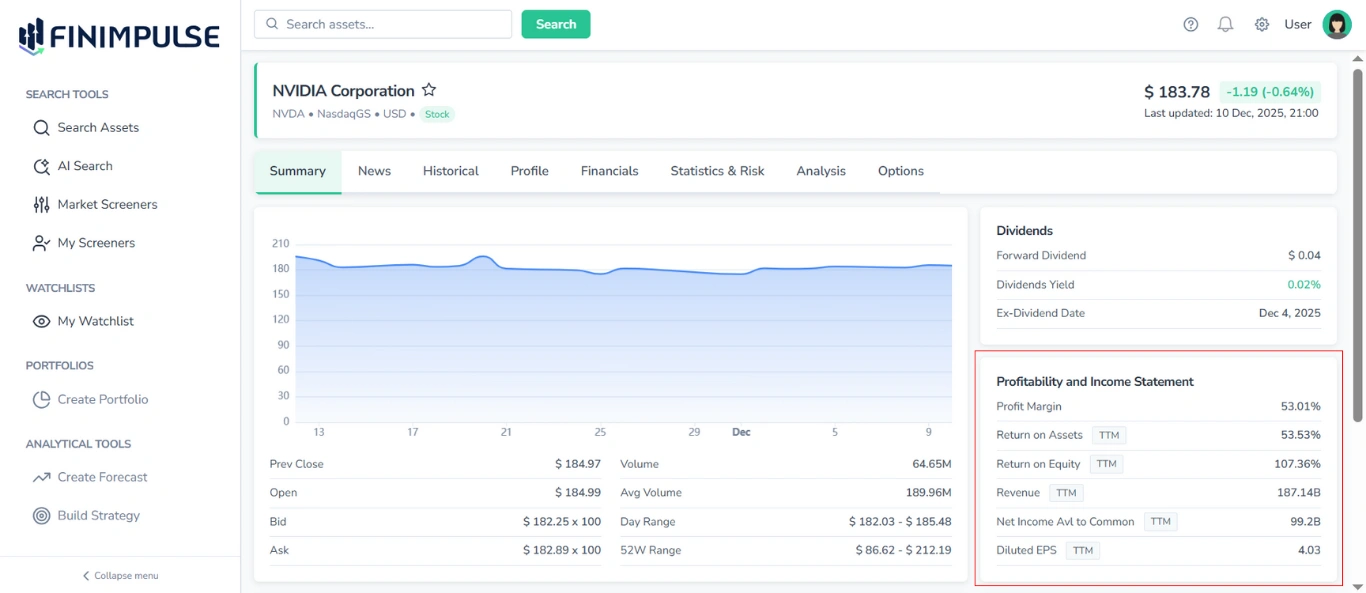
This table is a fundamental snapshot that includes:
- Profit Margin
- Return on Assets (TTM)
- Return on Equity (TTM)
- Revenue (TTM)
- Net Income Avl to Common (TTM)
- Diluted EPS (TTM)
1.5. Valuation & Multiples Table
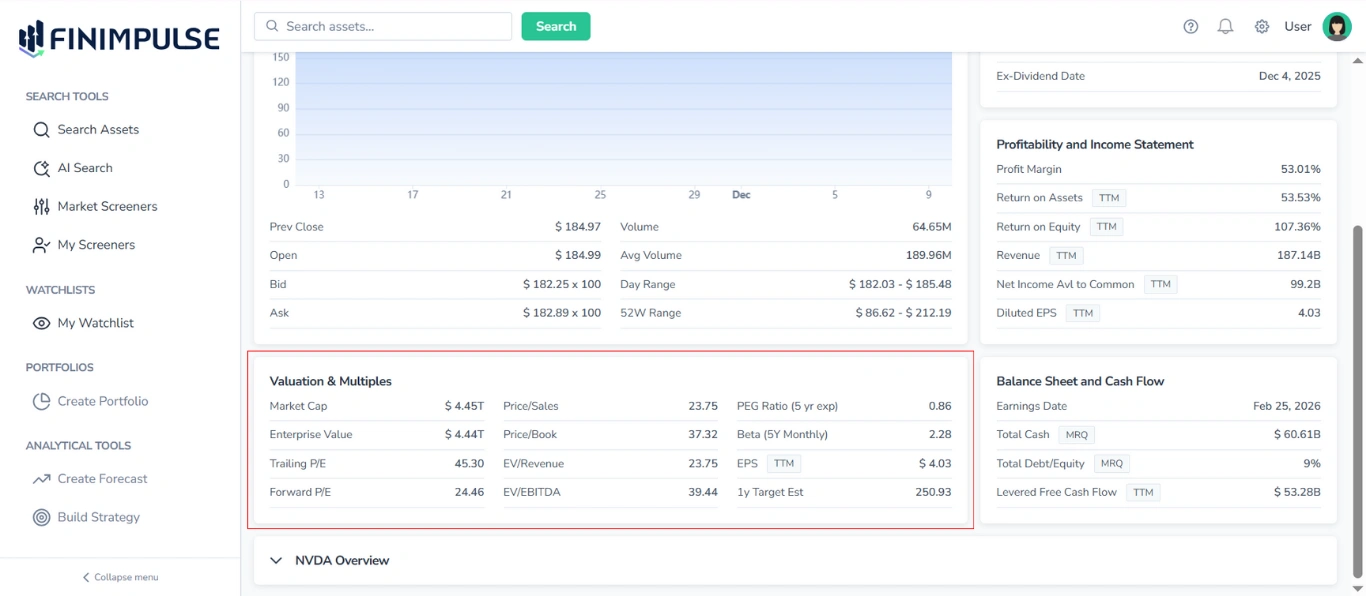
Provides an overview of key valuation metrics and trading multiples, including:
- Market Cap
- Enterprise Value
- Trailing P/E
- Forward P/E
- Price/Sales
- Price/Book
- EV/Revenue
- EV/EBITDA
- PEG Ratio (5 yr exp)
- Beta (5Y Monthly)
- EPS (TTM)
- 1y Target Est
1.6. Balance Sheet and Cash Flow Table
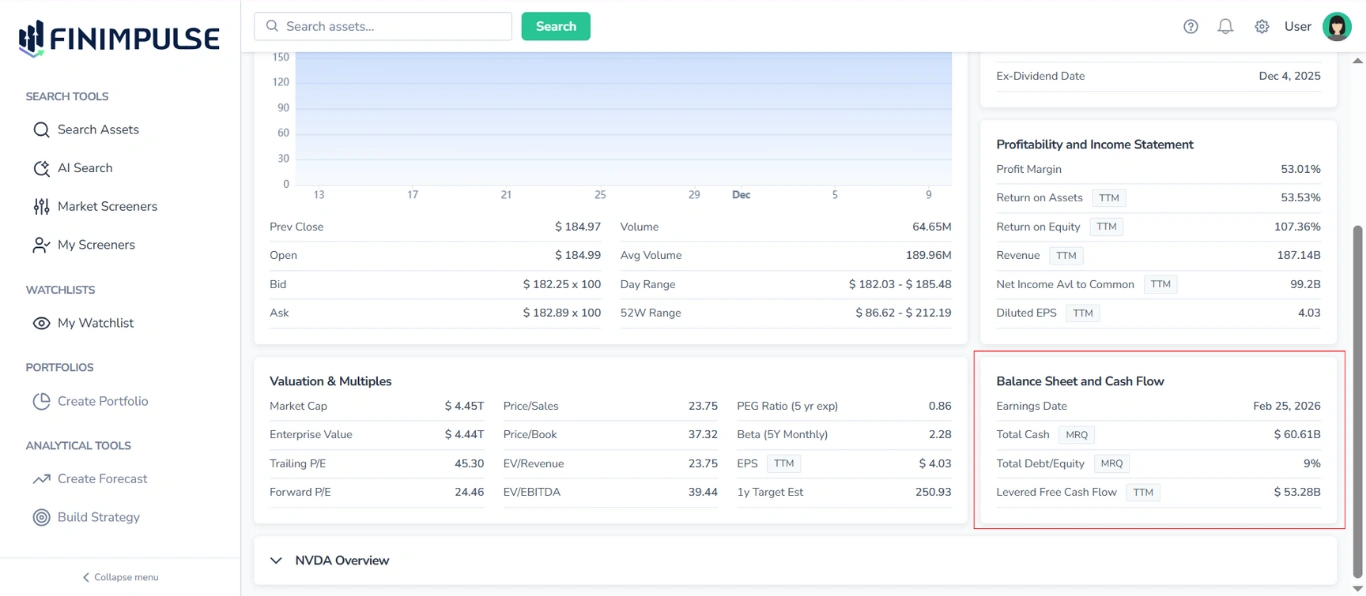
Highlights balance sheet and cash flow metrics. Typical fields are:
- Earnings Date
- Total Cash (MRQ)
- Total Debt/Equity (MRQ)
- Levered Free Cash Flow (TTM)
1.7. Asset Overview Section
Located at the bottom of the Summary tab, this section provides a concise summary of the asset’s basic information.
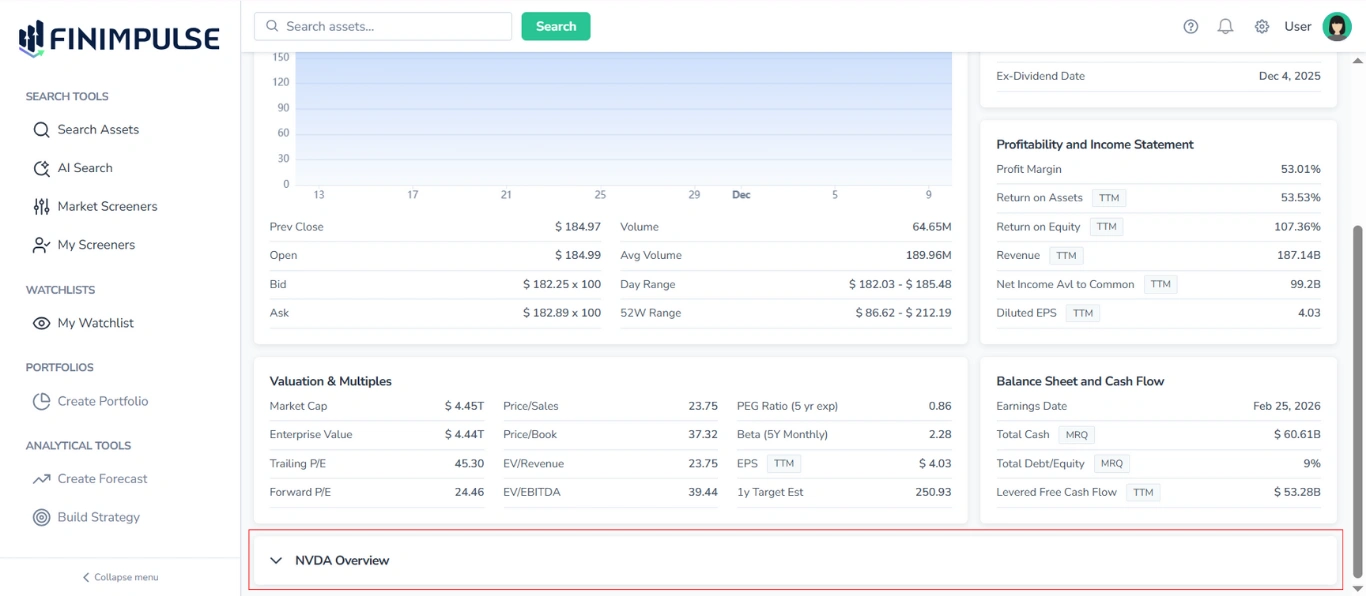
To see details: Click the section.
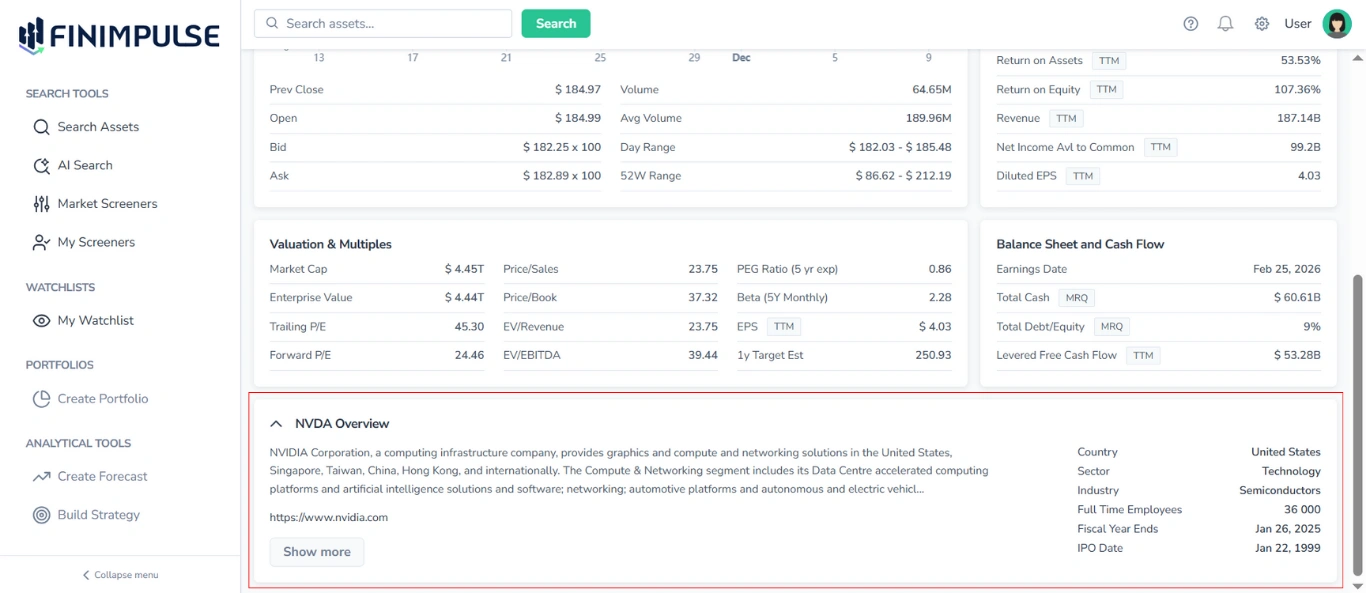
It contains the following information:
- Ticker
- Description (click Show more to expand and read the full text)
- Link to the Company’s website (if available)
- Country
- Sector
- Industry
- Full Time Employees (number)
- Fiscal Year Ends (date)
- IPO Date
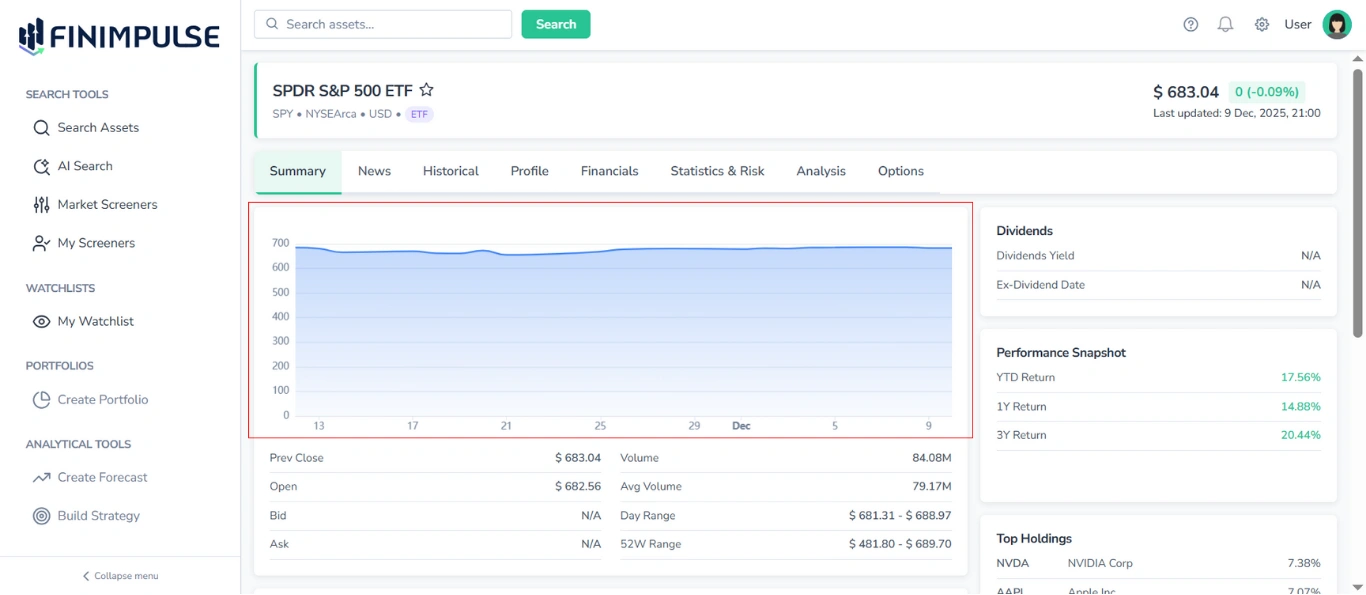
2. Summary Tab Content for ETFs
2.1. Price Chart
A chart that provides a visual illustration of price movement over the past 30 days for informational purposes.
2.2. Price & Volume Table
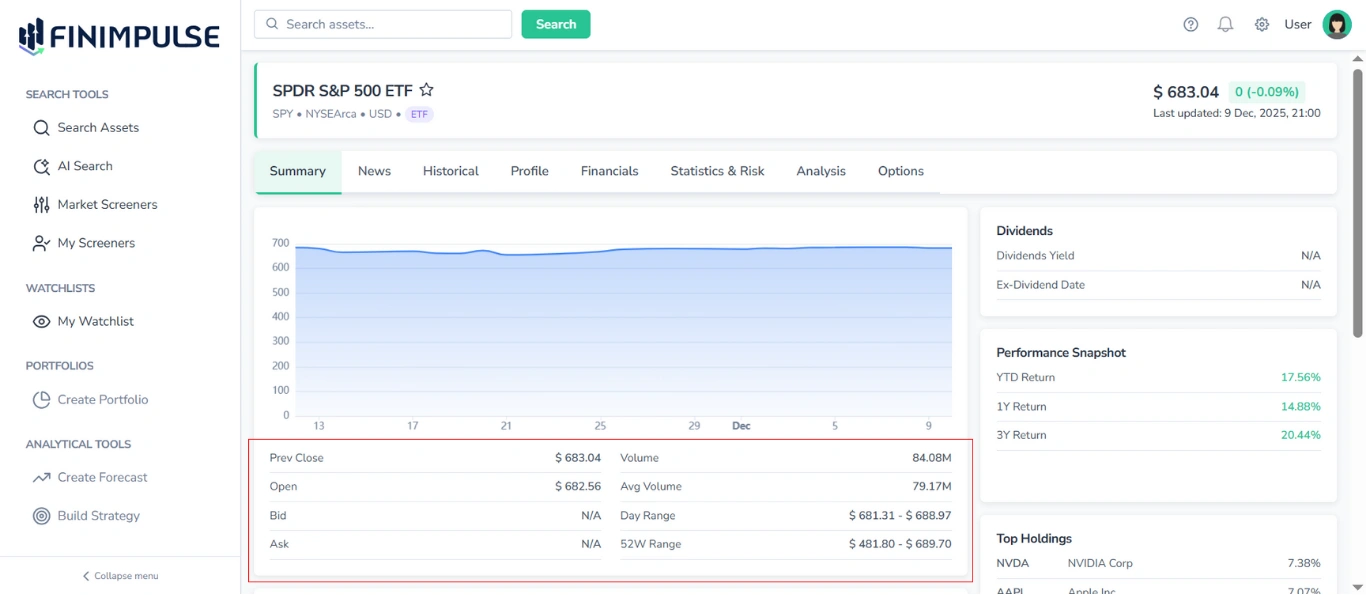
Located under the Price Chart, this table shows:
- Prev Close
- Open
- Bid / Ask
- Day Range
- 52W Range
- Volume
- Avg Volume
2.3. Dividends Table
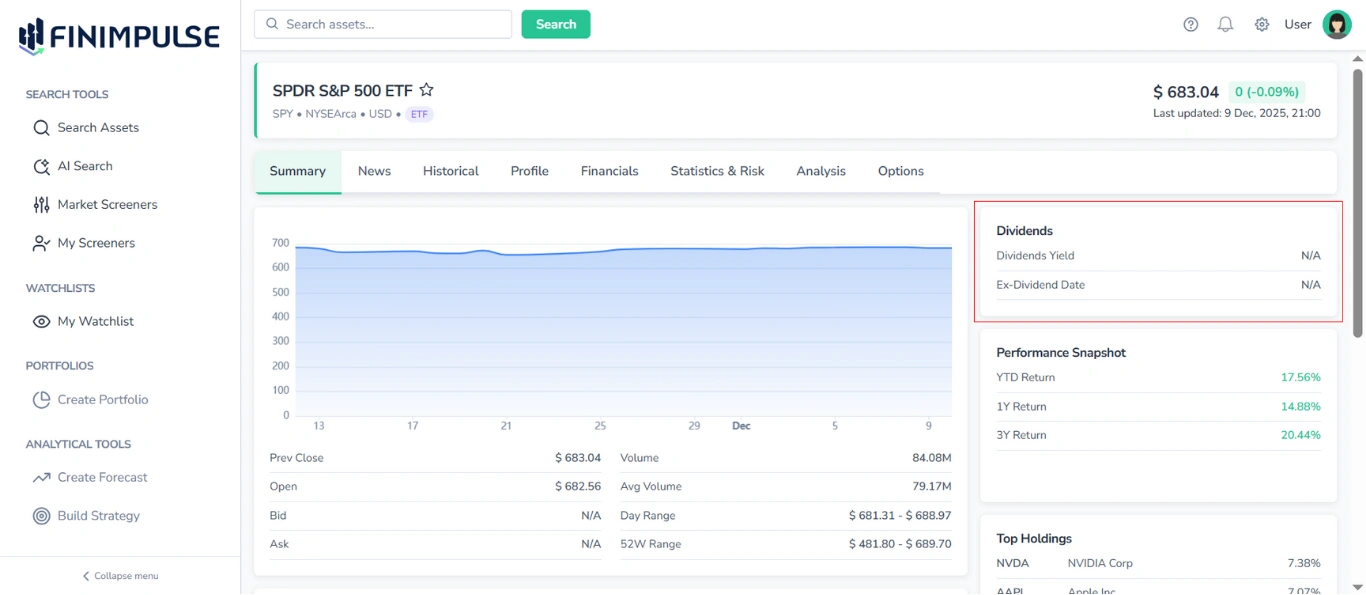
It shows:
- Dividend Yield
- Ex-Dividend Date
2.4. Performance Snapshot Table
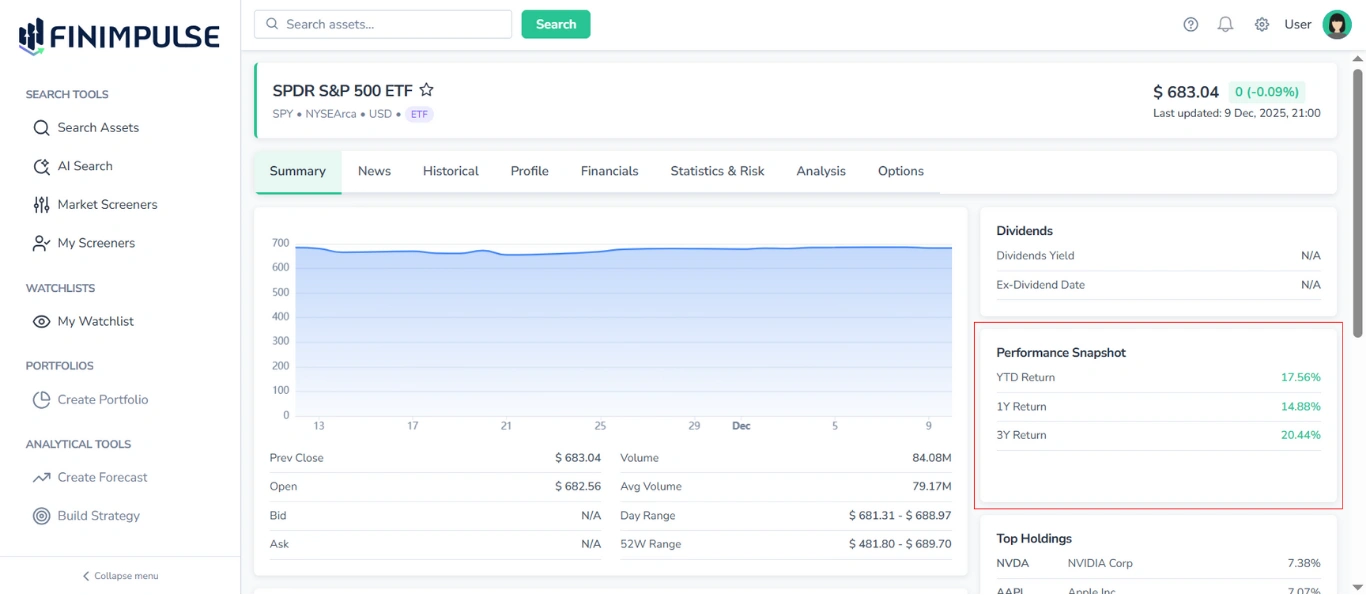
Displays key performance metrics. Typical fields include:
- YTD Return
- 1Y/3Y Return
2.5. Key Fund Metrics Table
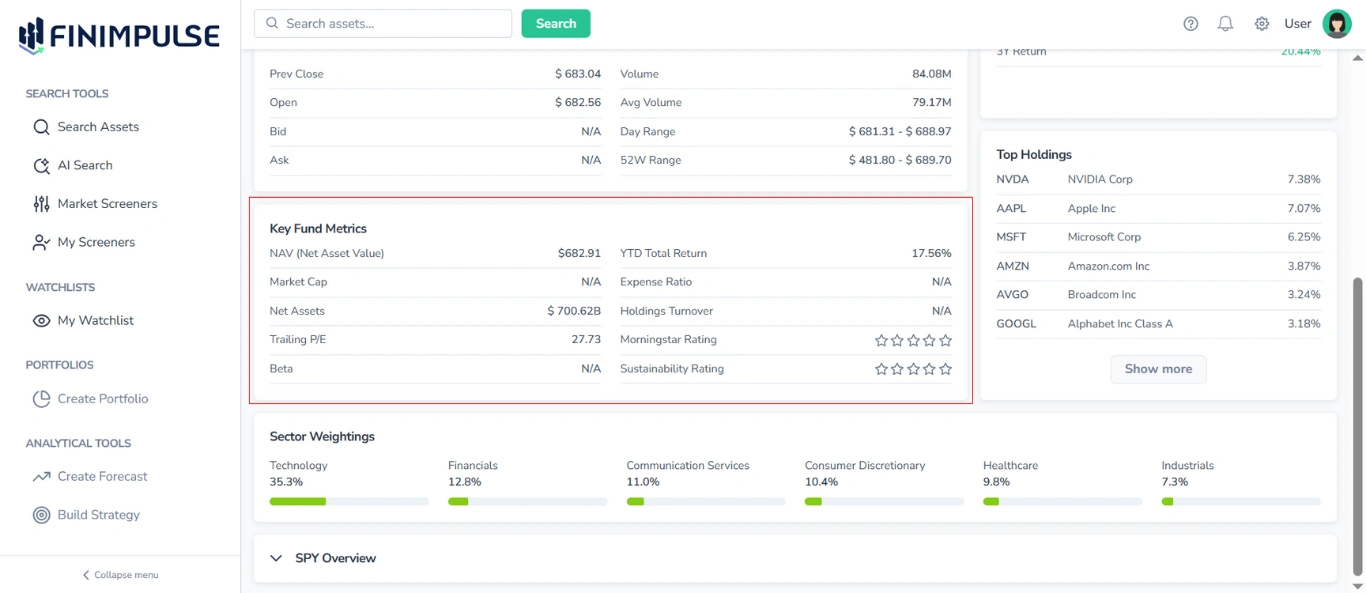
Provides a summary of important ETF-specific metrics, including:
- NAV (Net Asset Value)
- Market Cap
- Net Assets
- Trailing P/E
- Beta
- YTD Total Return
- Expense Ratio
- Holdings Turnover
- Ratings
Note: Ratings are displayed using star icons. Filled stars indicate the assigned rating, while empty stars indicate that a rating is not available.
2.6. Top Holdings Table
Lists the largest holdings in the ETF’s portfolio.
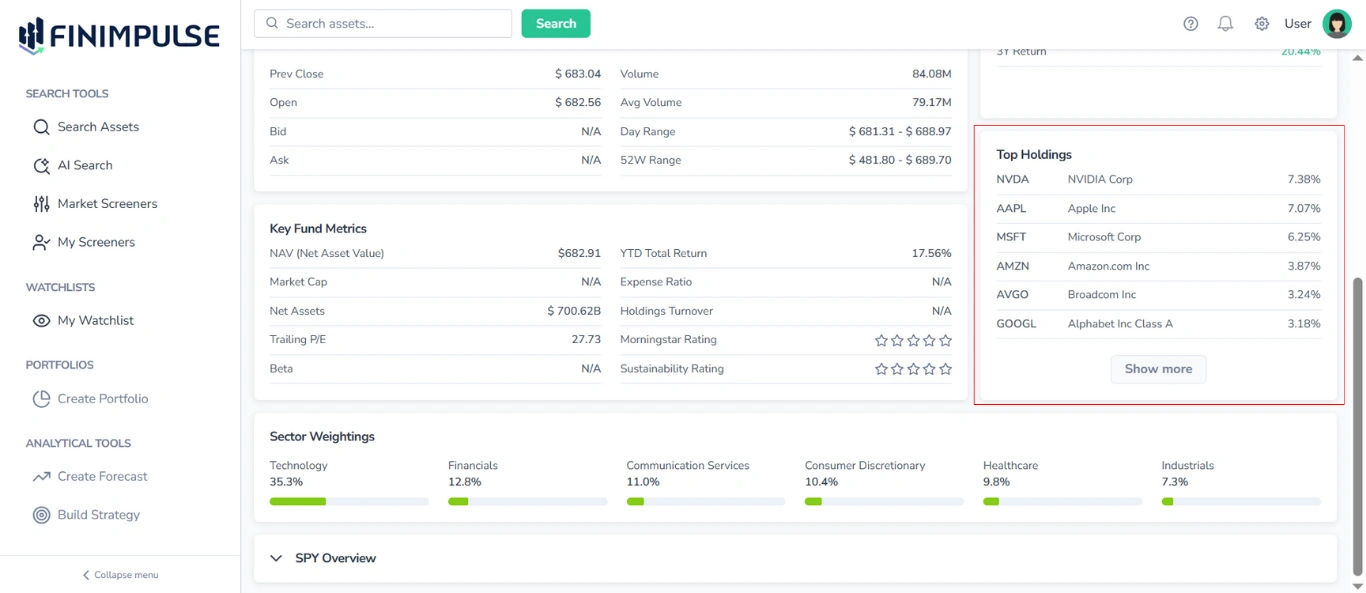
For each holding, the following information is shown:
- Ticker
- Company Name
- Portfolio Weight (percentage share in the portfolio)
By default, only the top holdings are displayed.
To view the complete list: Click the “Show more” button.
2.7. Sector Weightings Area
Displays the portfolio’s sector allocation, showing the percentage of the ETF’s holdings invested in each industry sector (e.g., Technology, Financials, Healthcare, etc.).

For each industry, the following information is shown:
- Sector Name
- Portfolio Weight (percentage of total fund assets allocated to that sector)
- Visual Representation (a horizontal bar, where the green portion fills to match the percentage value)
This section provides insight into the ETF’s sector diversification and overall portfolio structure.
2.8. Asset Overview Section
Located at the bottom of the Summary tab, this section provides a summary of basic information about the chosen ETF.
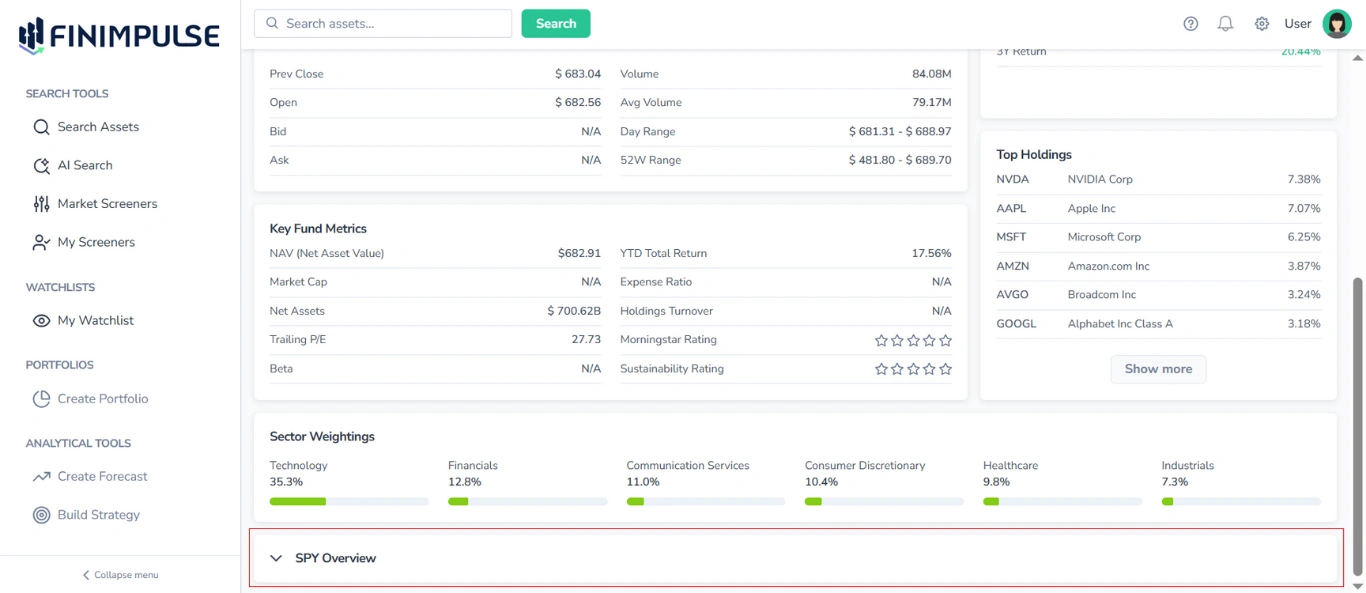
To see details: Click the section.
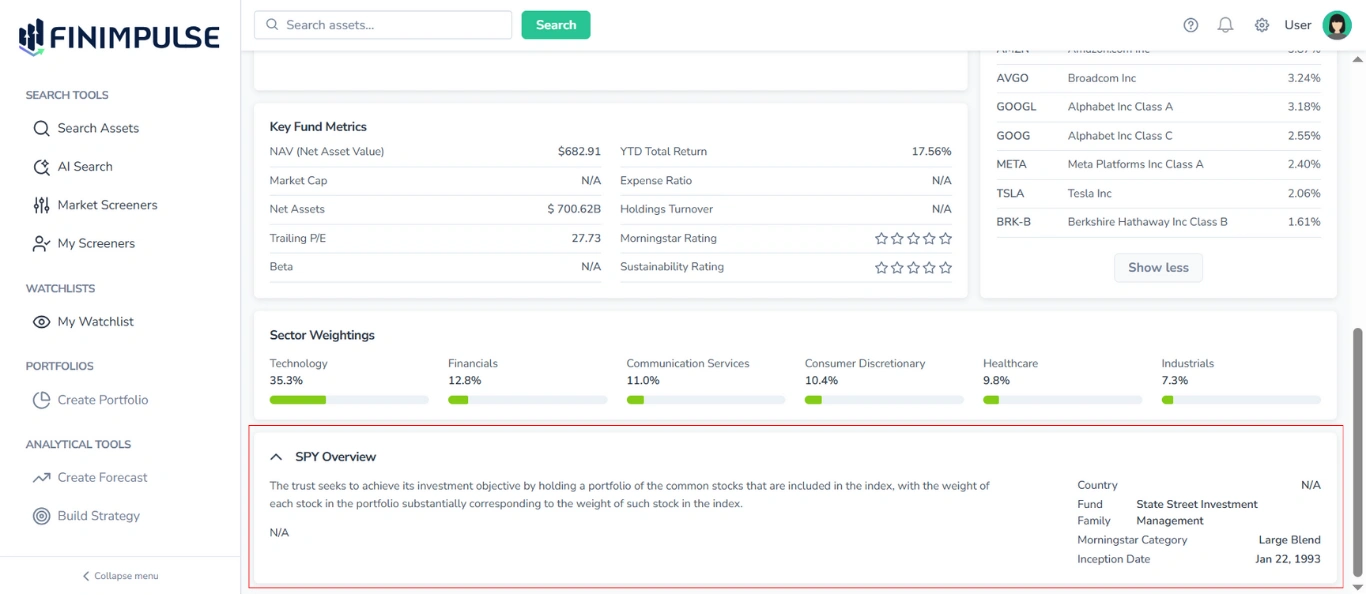
The Overview section contains the following information:
- Ticker
- Description (Click Show more to view the entire text if it is long)
- Link to the website (if available)
- Country
- Fund Family
- Category
- Inception Date
3. Summary Tab Content for Mutual Funds
3.1. Price Chart
A chart that provides a visual illustration of price movement over the past 30 days for informational purposes.

3.2. Price & Volume Table
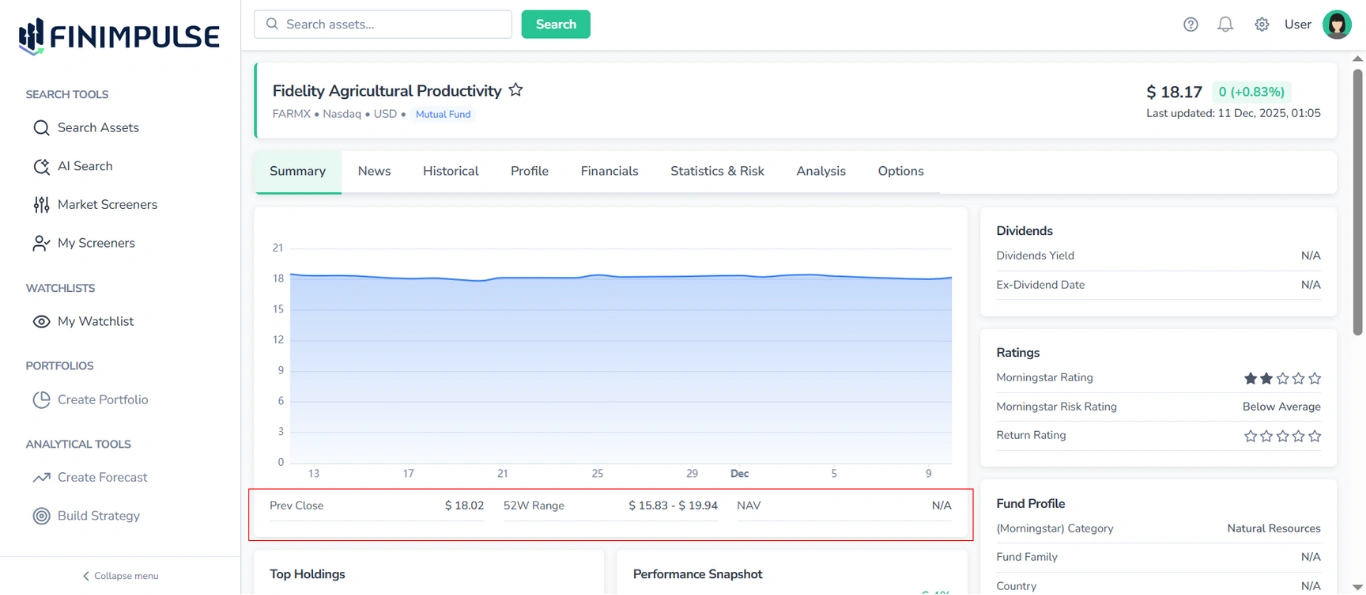
Located under the Price Chart, this table shows:
- Prev Close
- 52W Range
- NAV
3.3. Dividends Table
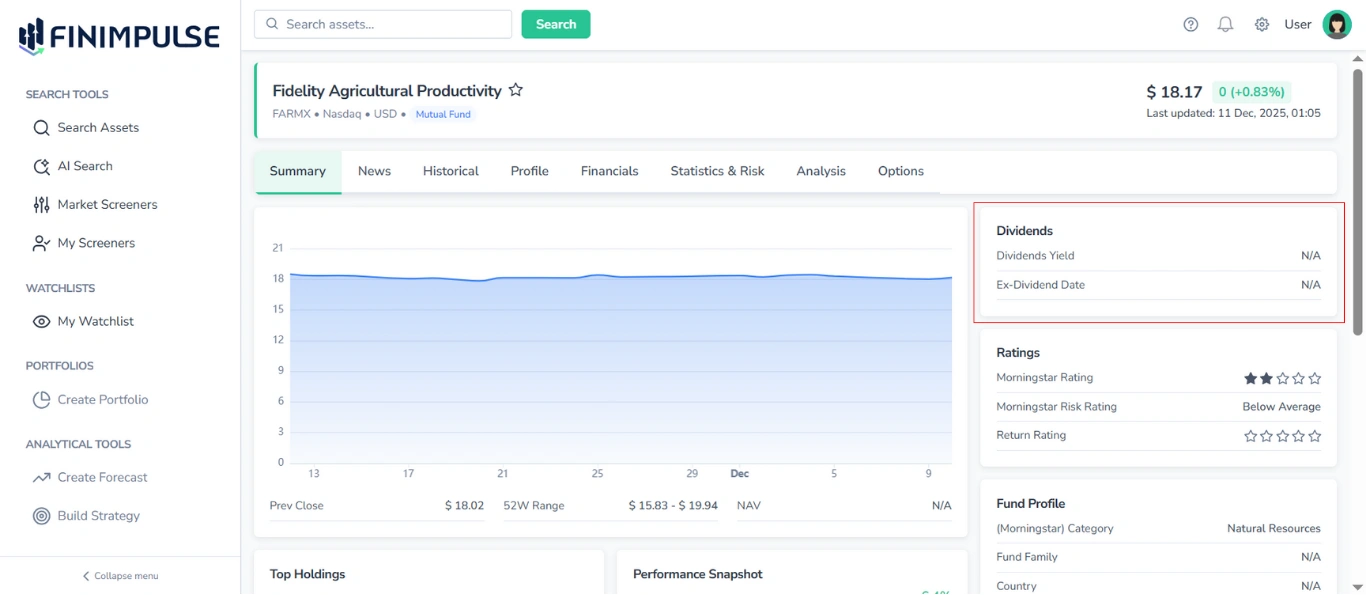
It shows:
- Dividend Yield
- Ex-Dividend Date
3.4. Ratings Table
Displays different ratings of the fund.

Note: Some Ratings are displayed using star icons. Filled stars indicate the assigned rating, while empty stars indicate that a rating is not available.
3.5. Top Holdings Table
Lists the largest holdings in the Mutual Fund’s portfolio.
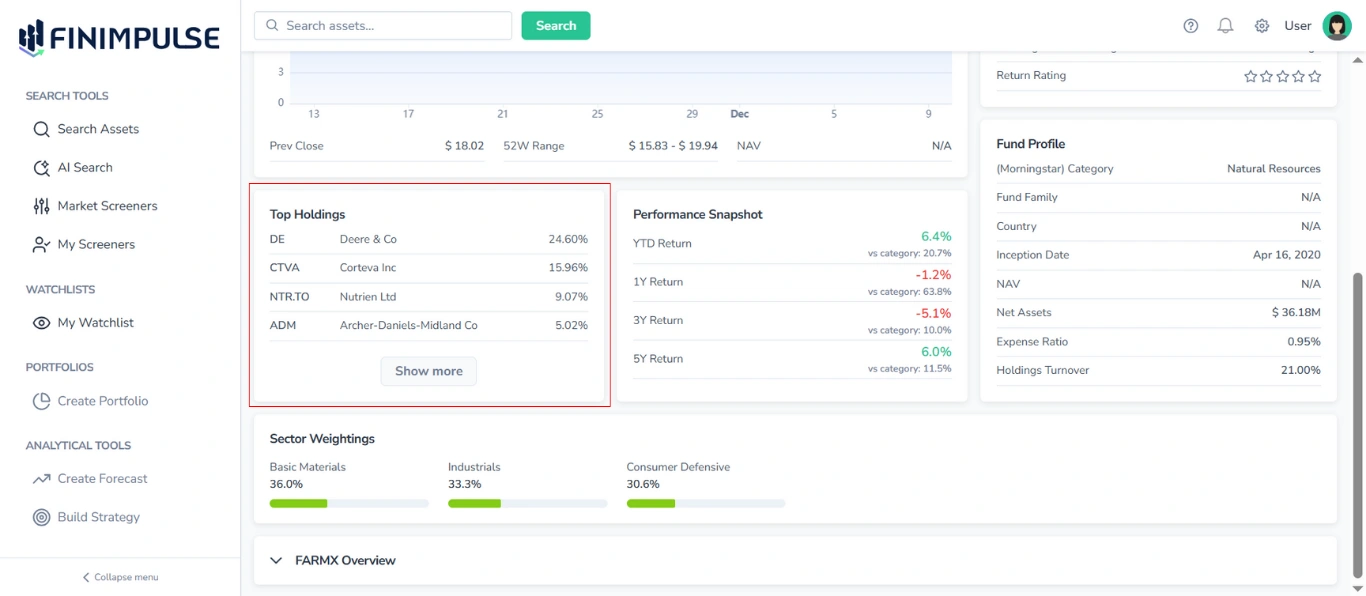
For each holding, the following information is shown:
- Ticker
- Full Company Name
- Portfolio Weight (percentage share in the portfolio)
By default, only the top holdings are displayed.
To view the complete list: Click the “Show more” button.
3.6. Performance Snapshot Table
Displays key performance metrics.
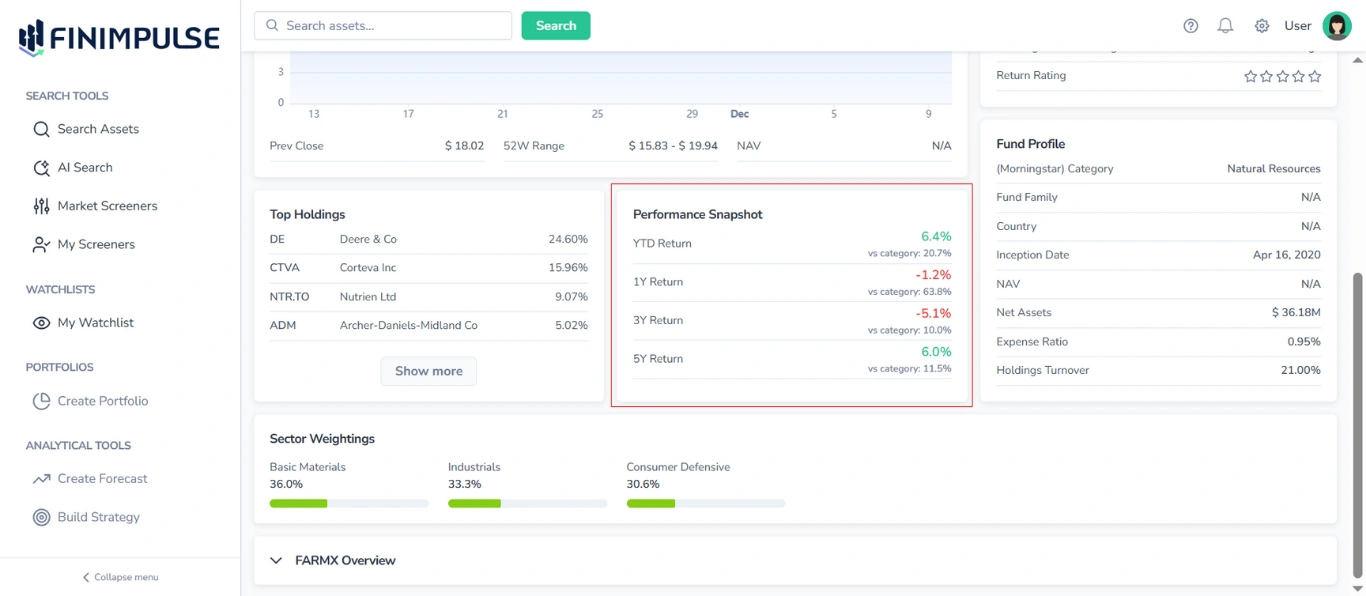
Typical fields include:
- YTD Return
- 1Y/3Y/5Y Return
Also, each return is compared to the average performance of the relevant category.
Values are color-coded — green for positive performance and red for negative performance — making it easy to visually identify trends and outliers.
3.7. Fund Profile Table
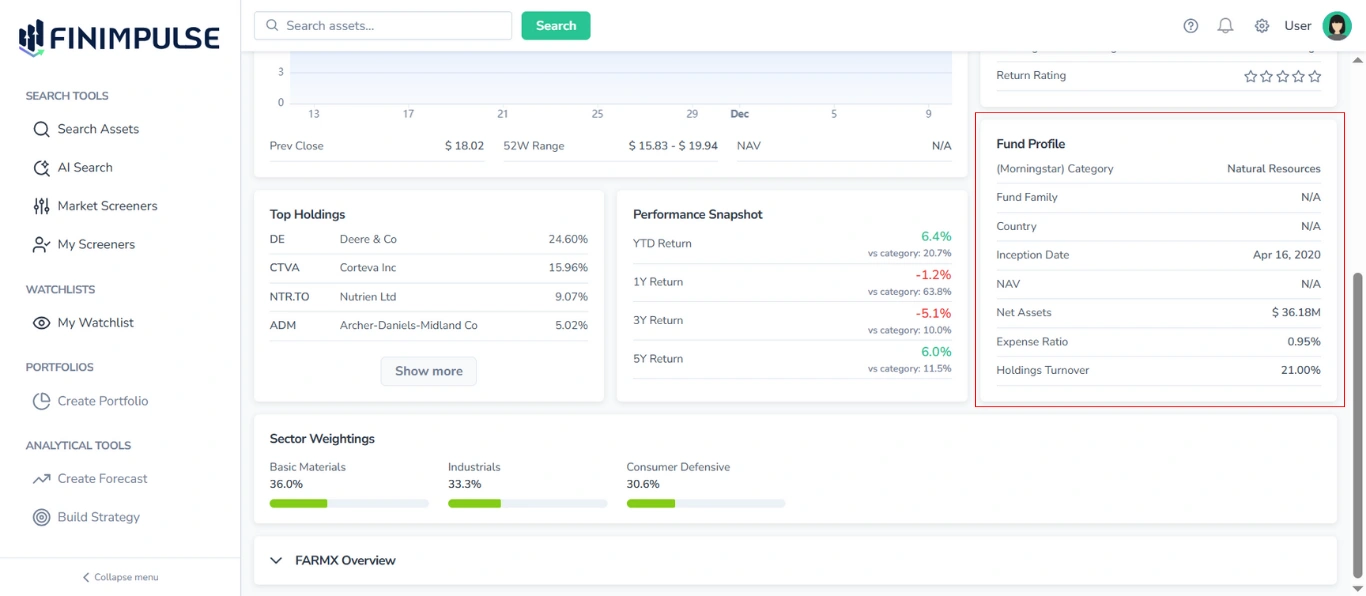
Provides main information about the fund, including:
- Category
- Fund Family
- Country
- Inception Date
- NAV
- Net Assets
- Expense Ratio
- Holdings Turnover
3.8. Sector Weightings Area
Displays the portfolio’s sector allocation, showing the percentage of the fund’s holdings invested in each industry sector (e.g., Technology, Financials, Healthcare).
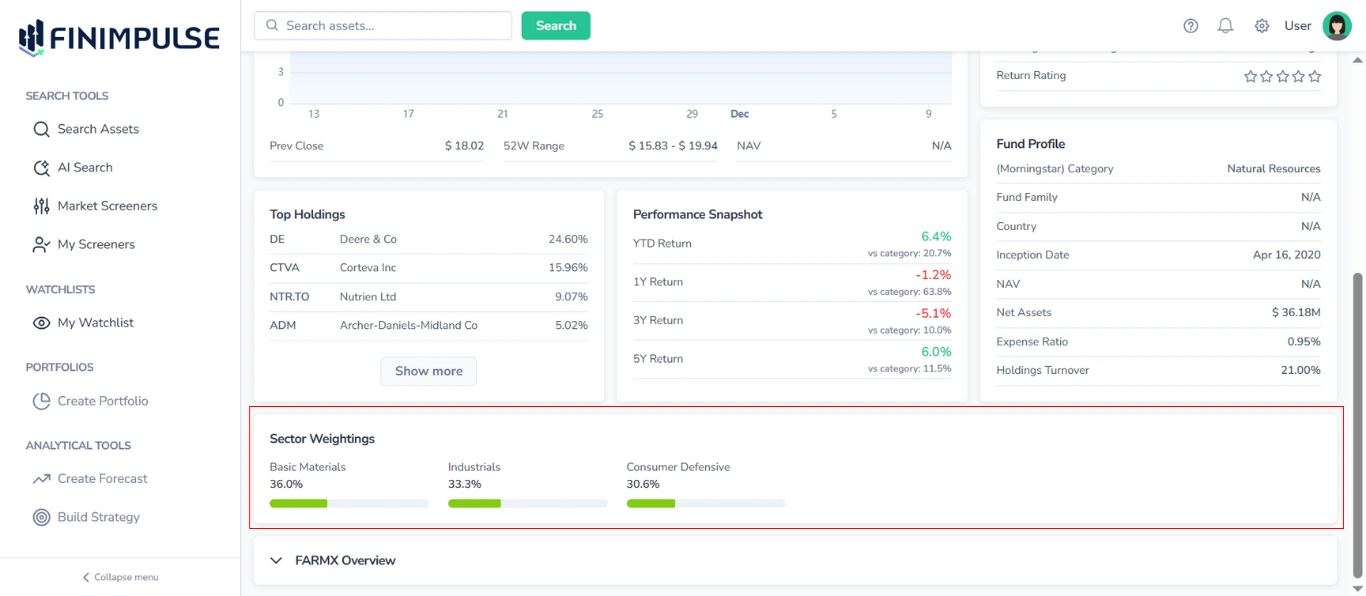
For each industry, the following information is shown:
- Sector Name
- Portfolio Weight (percentage of total fund assets allocated to that sector)
- Visual Representation (a horizontal bar, where the green portion fills to match the percentage value)
This section provides insight into the fund’s sector diversification and overall portfolio structure.
3.9. Asset Overview Section
Located at the bottom of the Summary tab, this section provides a summary of basic information about the chosen Mutual Fund.
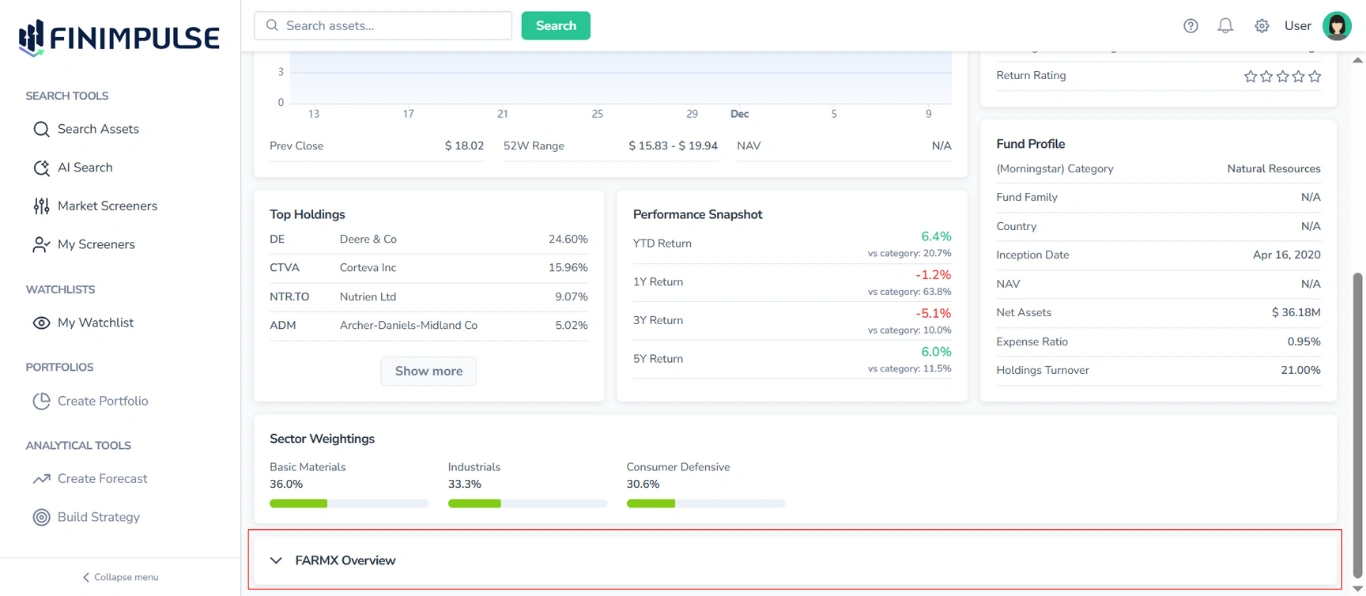
To see details: Click the section.
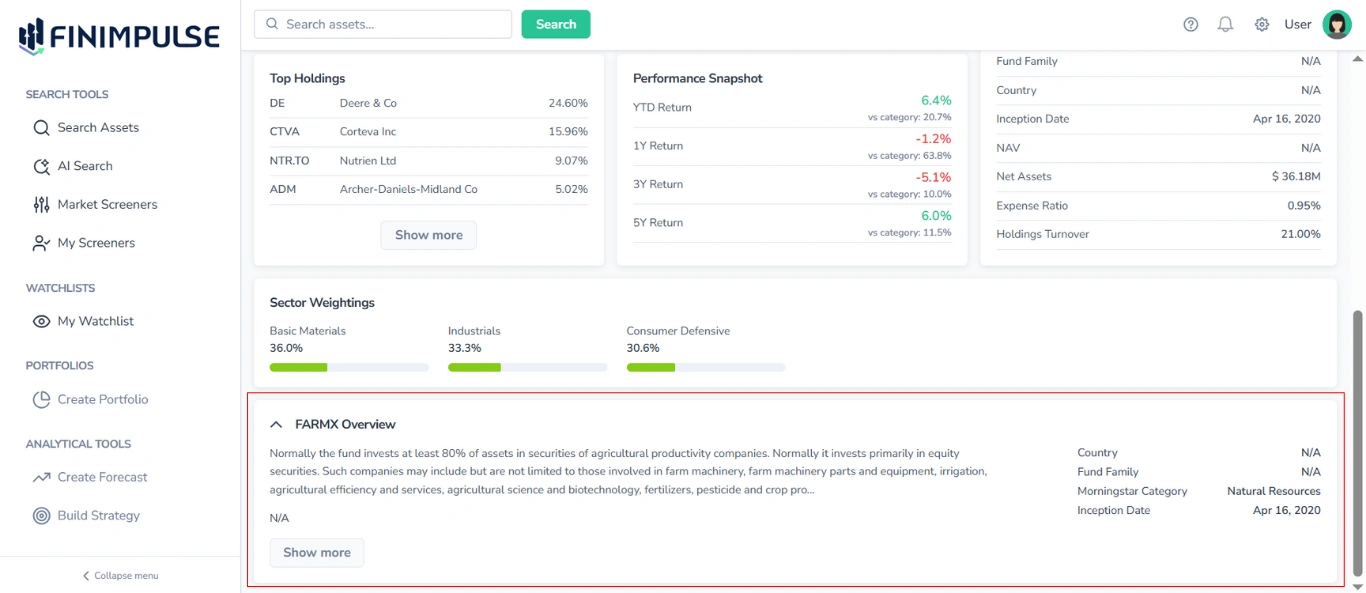
The Overview section contains the following information:
- Ticker
- Description (click Show more to expand and read the full text)
- Link to the website (if available)
- Country
- Fund Family
- Category
- Inception Date