
52-Week Highs & Lows: Understanding Market Momentum and Value Signals
A breakdown of how 52-week levels reveal both momentum and valuation opportunities.
When a stock hits its 52-week high or 52-week low, it’s rarely a coincidence. These levels mark psychological milestones — points where investors collectively decide whether a trend will continue or reverse. The Price Levels screeners in FinImpulse — Recent 52-Week Highs and Recent 52-Week Lows — help you identify these turning points across global markets.
What Are 52-Week Highs and Lows?
A 52-week high is the highest price at which a stock has traded over the past 12 months. Conversely, a 52-week low refers to the lowest price recorded during the same period. These benchmarks define the stock’s trading range and highlight how far the current price is from historical peaks or troughs, reflecting periods of heightened investor optimism (highs) or pessimism (lows).
- Stocks near their 52-week highs often indicate strength, momentum, and confidence.
- Stocks near their 52-week lows may signal undervaluation, overselling, or market pessimism.
Professional traders watch these levels closely because they often act as support (for lows) or resistance (for highs). Support refers to a price level where buying interest may prevent further decline, while resistance is where selling pressure may cap further gains.
How the FinImpulse Screener Works
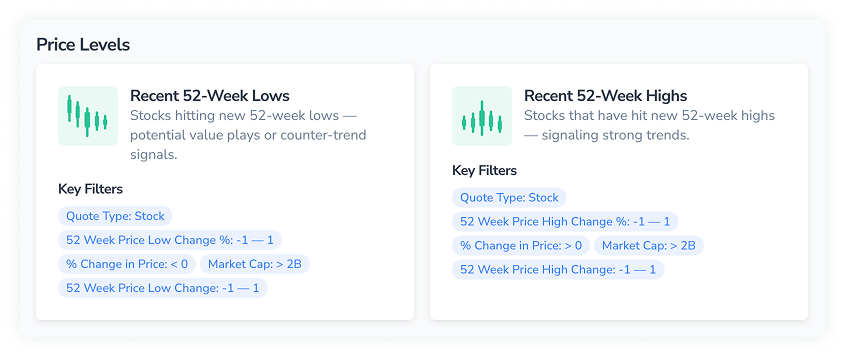
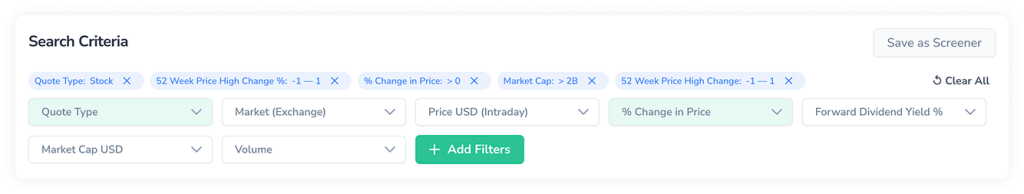
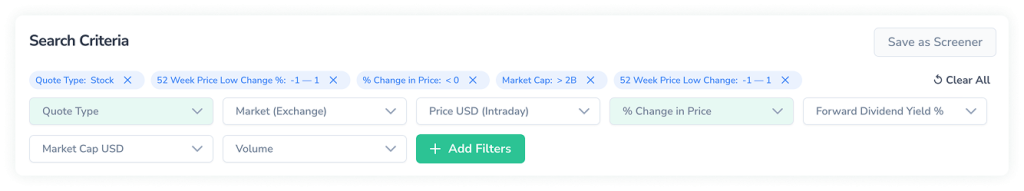
FinImpulse tracks thousands of tickers daily and identifies which ones are crossing these key levels. By default, both screeners use the following filters:
- Quote Type: Stock
- Market Cap: > 2B
- 52-Week Price Change %: within ±1% of the high/low
- % Change in Price: positive (for highs) or negative (for lows)
This logic ensures you see only meaningful breakouts — not random fluctuations. But you can go further:
- Limit by market or exchange (e.g., only Japan or Canada)
- Filter by sector (Tech, Energy, Financials)
- Add dividend yield, volume, or valuation ratios
- Compare local currency vs USD performance
Every screener is fully customizable — add or rearrange columns, or save your personal version with one click.
How to Read 52-Week Highs
When analyzing stocks that reach new highs, focus on:
- % Change from High: Values between 0% and +1% confirm the breakout.
- Volume: Strong confirmation if trading volume doubles vs average.
- Momentum indicators (like 50D/200D moving averages): If both trend upward, the breakout has a solid foundation.
- Sector trend: Are similar companies also hitting highs? That’s a powerful confirmation.
Example:
In early 2024, Microsoft and Oracle both reached new 52-week highs after AI-related earnings beats. Volume surged, and both exceeded prior resistance — a classic continuation signal for growth investors.
How to Read 52-Week Lows
For stocks hitting new lows, key things to check:
- % Change from Low: Near 0% means it’s just touched support.
- Fundamentals: If revenue or cash flow remains stable, it may be undervalued.
- Volume: Low volume at new lows can indicate that selling pressure is fading.
- Dividend yield: If it rises (due to a price drop), that might attract value investors.
- Analyst ratings: Compare sentiment — has the market overreacted?
Example:
PayPal and Intel traded near 52-week lows in mid-2023, but both maintained solid earnings and cash flow. Those who recognized the pattern early gained over +25% as prices rebounded within months.
Why 52-Week Levels Matter
These levels are psychological anchors for the market:
- Investors often set stop-loss or take-profit orders around them.
- Algorithms and institutional traders use them as signals for breakouts or reversals.
- Long-term investors use them to assess risk-to-reward ratios.
Watching these levels helps you understand whether the market is chasing momentum or rotating into undervalued assets.
Use Cases
- Momentum traders: Buy breakouts above 52-week highs with volume confirmation.
- Swing traders: Short-term trades near highs/lows for quick reversals.
- Value investors: Identify companies near 52-week lows with strong fundamentals.
- Portfolio managers: Track sector-wide highs/lows to rebalance allocations.
- Analysts: Use the screener for daily sentiment and market breadth reports.
How It Helps in FinImpulse
Finimpulse brings clarity to this process:
- Real-time filtering across global markets
- Custom columns to show metrics like RSI (Relative Strength Index), Beta (a measure of volatility relative to the market), or Dividend Yield (annual dividends as a percentage of share price)
- Comparative view — see how multiple markets behave simultaneously
- Option to export results or save as a Screener for daily tracking
This turns a static number — “52-week high” — into a dynamic, actionable market signal.
In Summary
The 52-Week Highs and Lows screeners reveal more than just price extremes — they capture the emotional state of the market. New highs indicate confidence, while new lows signal fear. Both can be profitable if you understand what they’re telling you. Use FinImpulse to filter, compare, and act — before the rest of the market catches up.